Strategy’s stock MSTR printed one of the rarest bullish reversal signals in technical analysis, the “Abandoned Baby,” on its daily chart, hinting that a brutal downtrend may be running out of steam.
Key takeaways
- MSTR’s rare reversal pattern suggests rising odds of a sharp rebound.
- Bitcoin volatility remains the key downside risk.
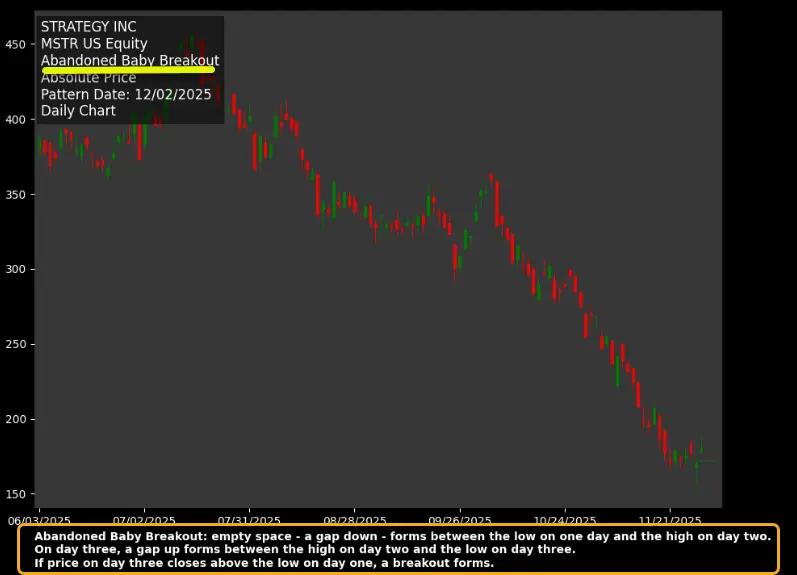 MSTR daily chart. Source: XHow high can MSTR go after printing the pattern? Let’s examine.
Why is Abandoned Baby turning MSTR bullish?
Abandoned Baby forms after a sharp downtrend and consists of three candles: a long bearish candle, a small indecision candle that gaps lower and a strong bullish candle that gaps higher, leaving the middle candle “abandoned.”
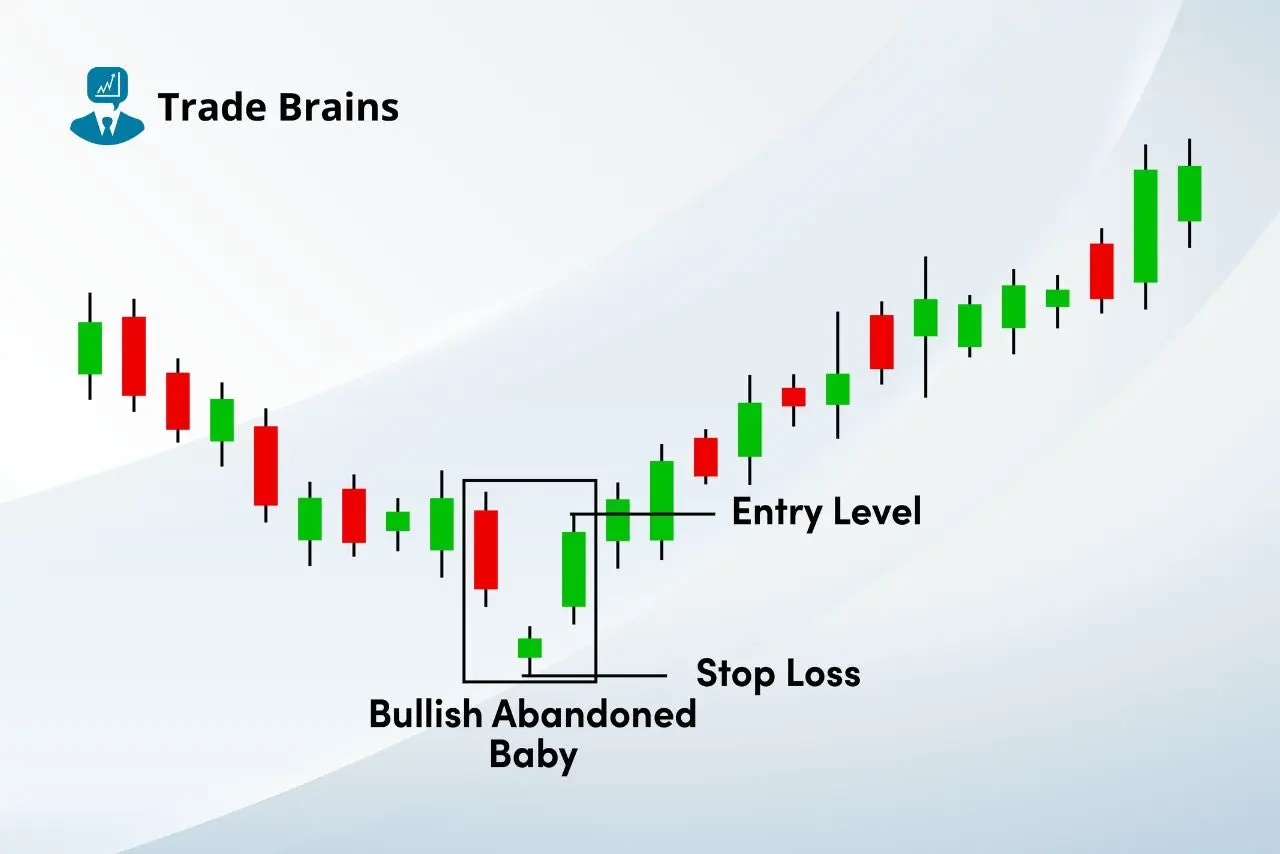 Abandoned Baby pattern illustrated. Source: Trade BrainsAnalyst The Bitcoin Therapist called the pattern “super rare” in an X post on Thursday, adding:
“Studies and big quant firms show it’s one of the most reliable reversal signals available. In simple terms: it’s the market’s version of a unicorn.”
How high can MSTR prices go next?
MSTR charts displayed the Abandoned Baby pattern after witnessing a multimonth downtrend, during which its rates plunged by around 66% from their 2025 peak, reaching $155.61 on Monday.
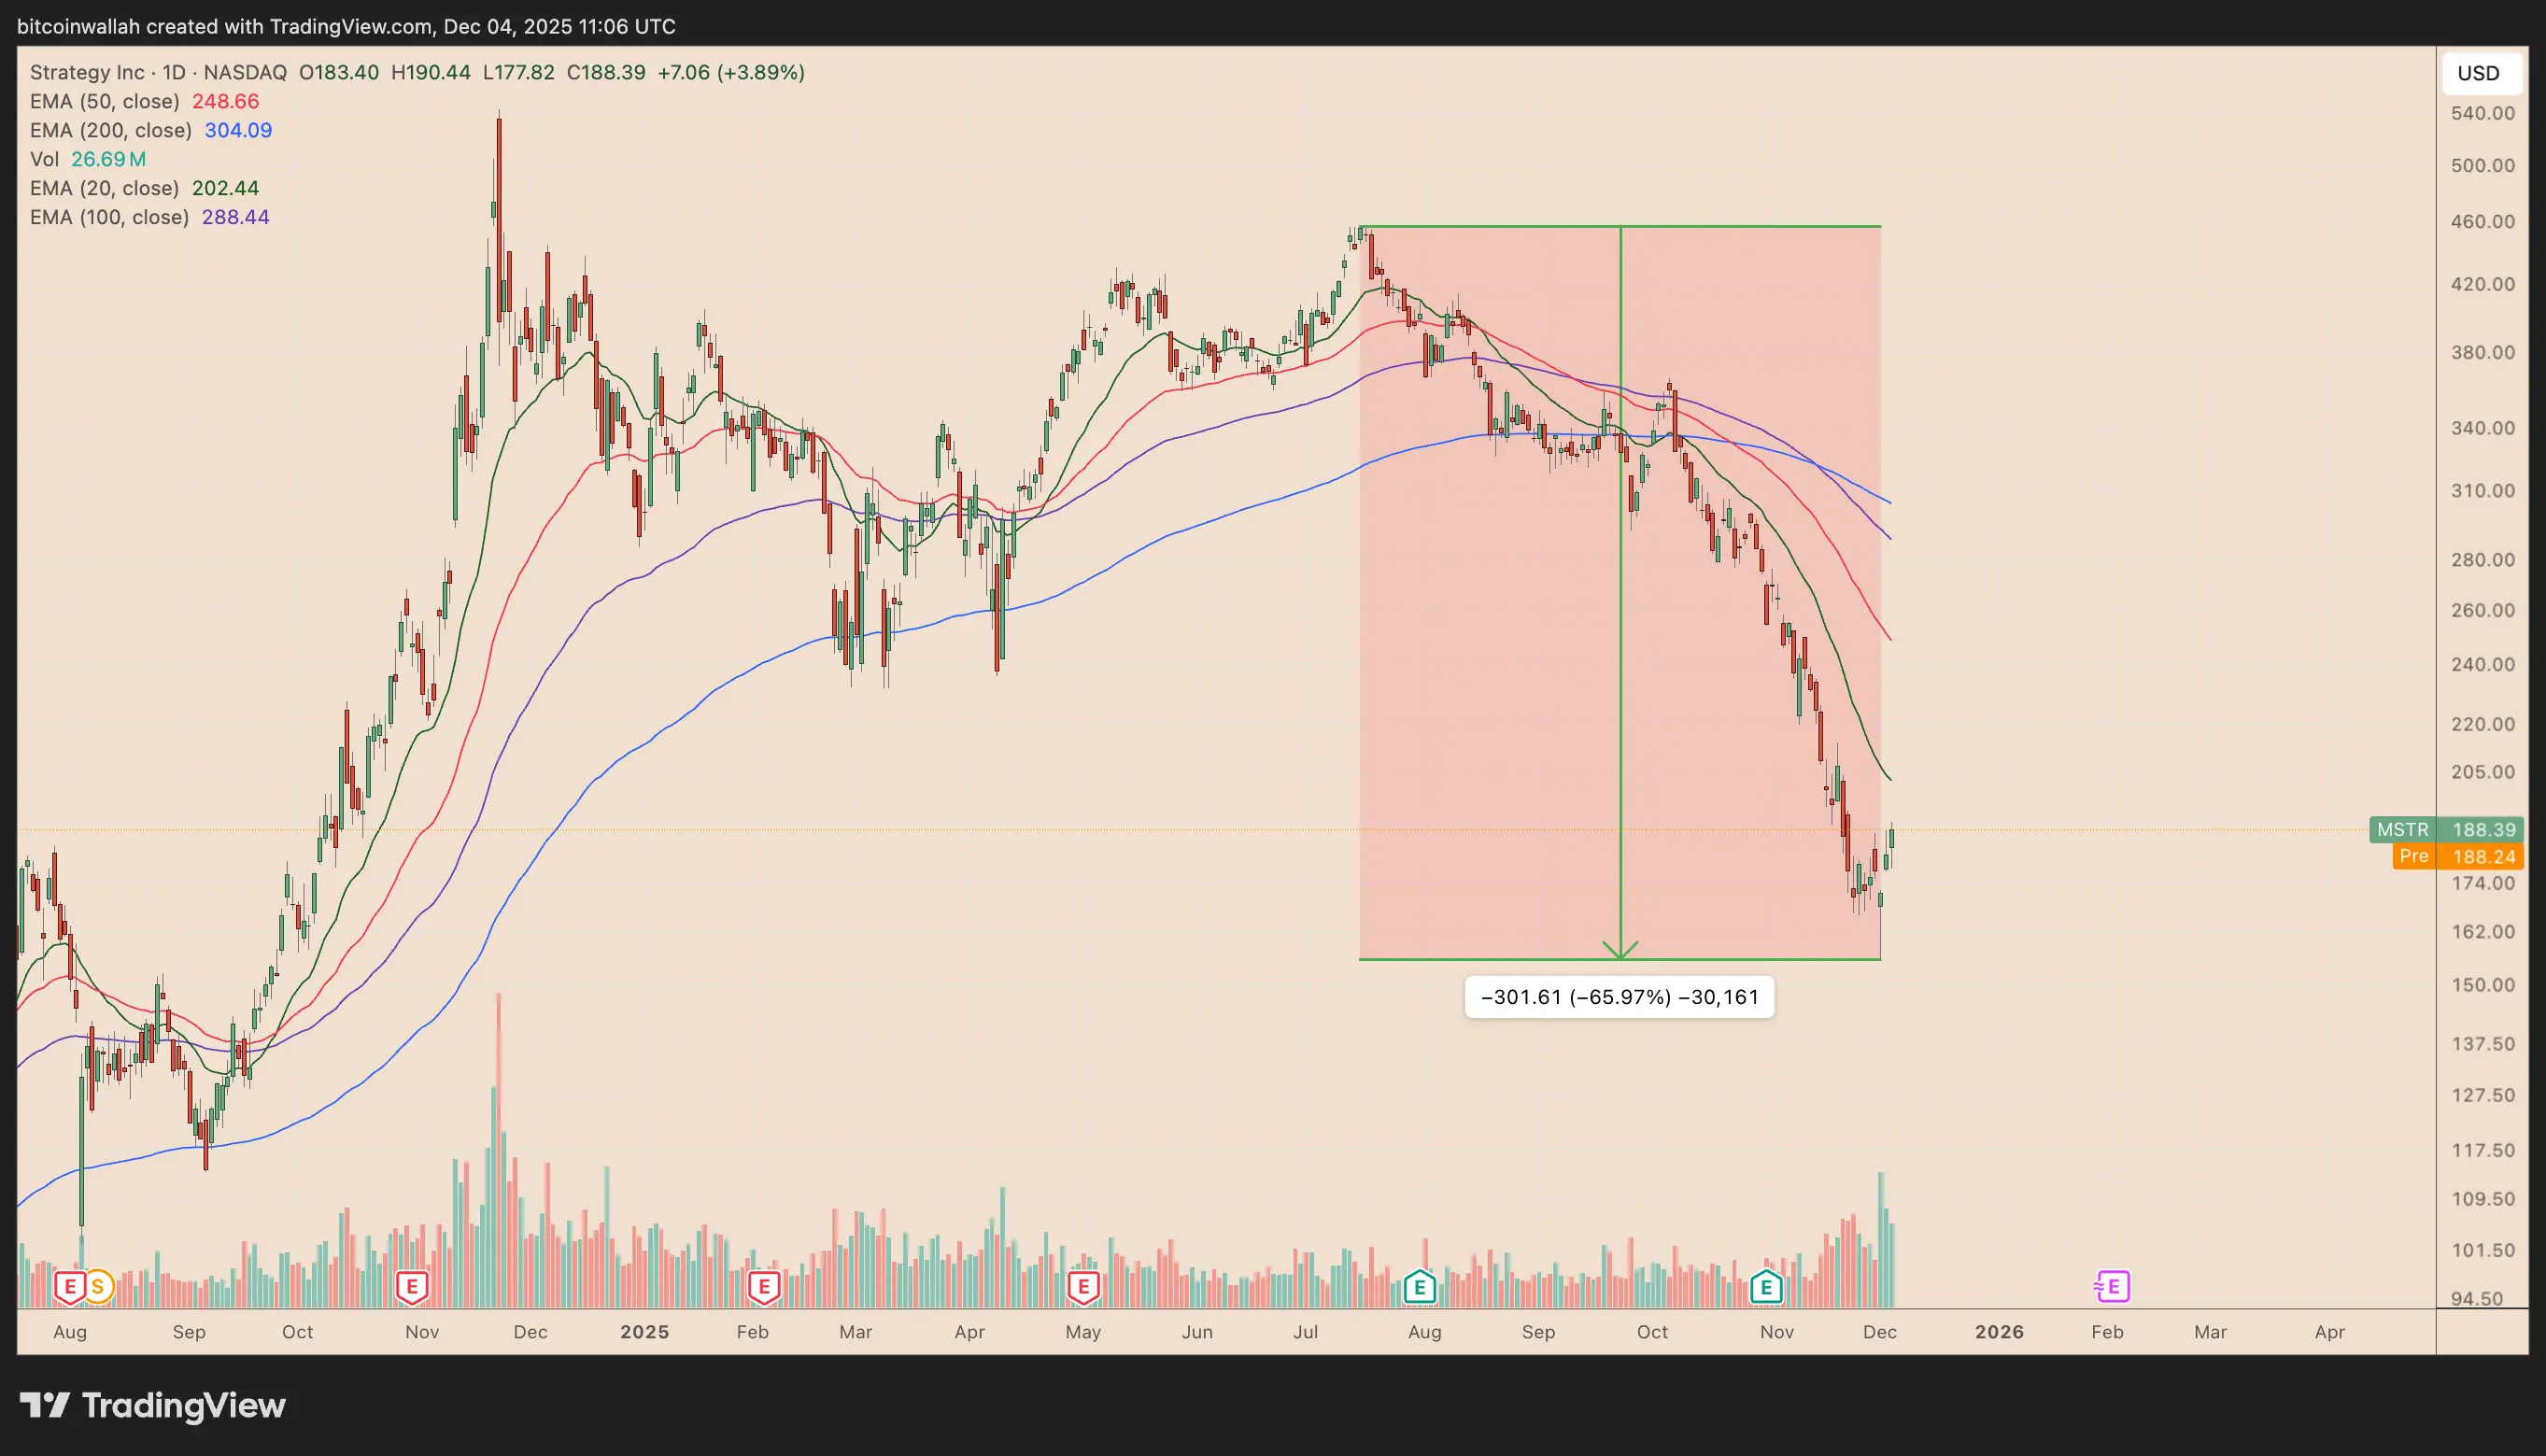 MSTR daily chart. Source: TradingViewThe stock recovered by around 22.50% from the Monday nadir, helped by a sharp rebound in the Bitcoin (BTC) market amid rising odds of a Federal Reserve rate cut in December.
The macro backdrop strengthened the bullish case for MSTR, with traders pointing to multiple technical confirmations.
Related: Strategy will sell Bitcoin as ‘last resort’ if mNAV drops, capital is unavailable: CEO
On Wednesday, analyst Lark Davis highlighted the appearance of a hammer candle near the lows and an oversold relative strength index (RSI), both of which typically signal seller exhaustion and a shift in risk-reward back to the buyers.
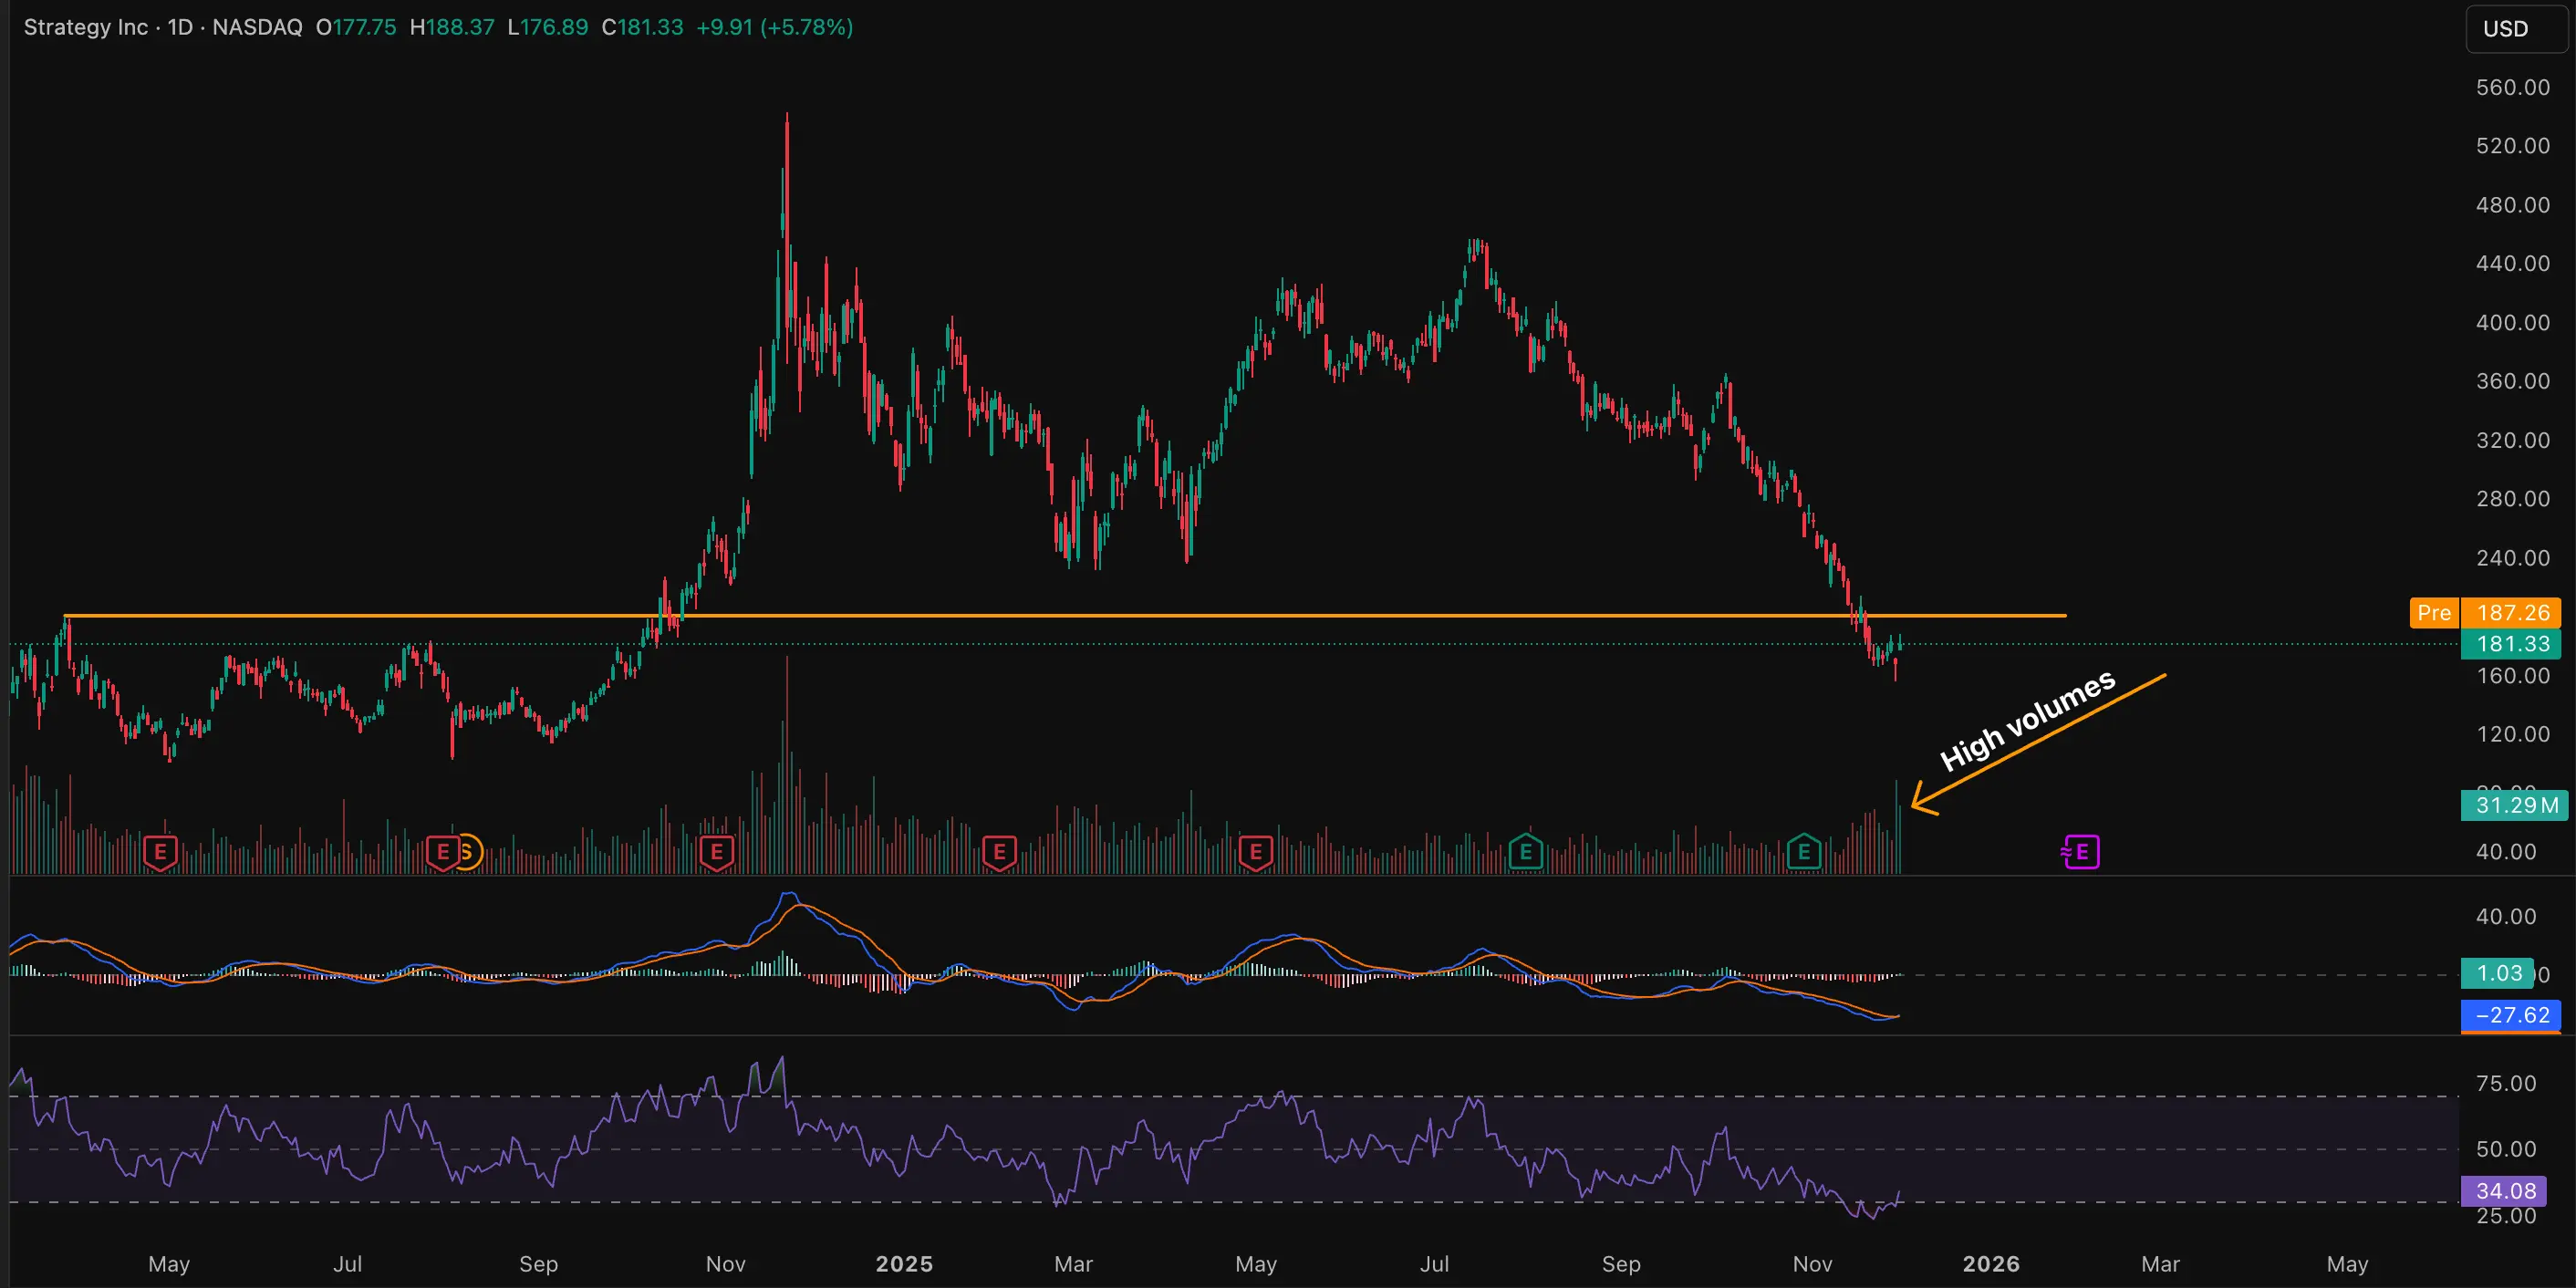 MSTR daily chart. Source: TradingView/Lark DavisOptions trader Brando predicted an “aggressive move back above 200,” and even 280, which is up 50% from current prices, if the prevailing macro and technical conditions persist.
He added:
“MicroStrategy has finally reached a level where the risk-to-reward is starting to lean heavily to the upside. Lots of bearish sentiment surrounding this name lately, which could provide an opportunity when many are scared.”
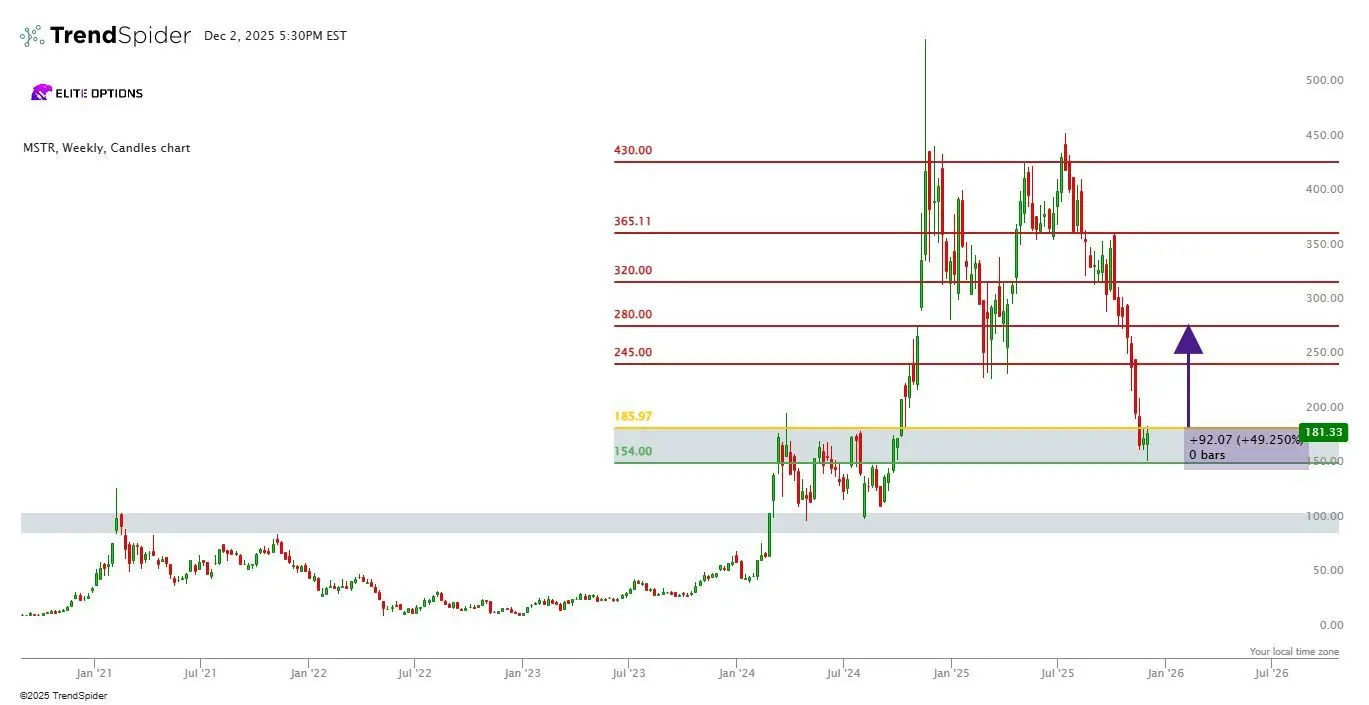 MSTR weekly chart. Source: TrendSpider/BrandoDan Dolev, analyst at Mizuho Securities, predicted that the MSTR stock price could reach $484.
Downside risks remain if Bitcoin turns volatile again, particularly if spot ETF inflows cool or December rate-cut expectations fade, a setup that would likely hit MSTR harder.
This article does not contain investment advice or recommendations. Every investment and trading move involves risk, and readers should conduct their own research when making a decision.
This article does not contain investment advice or recommendations. Every investment and trading move involves risk, and readers should conduct their own research when making a decision. While we strive to provide accurate and timely information, Cointelegraph does not guarantee the accuracy, completeness, or reliability of any information in this article. This article may contain forward-looking statements that are subject to risks and uncertainties. Cointelegraph will not be liable for any loss or damage arising from your reliance on this information.
- #Bitcoin
- #Markets
- #Stocks
- #Tech Analysis
- #Market Analysis
- #MicroStrategy
Add reaction
![]()
Disclaimer: The information on this page may come from third parties and does not represent the views or opinions of Gate. The content displayed on this page is for reference only and does not constitute any financial, investment, or legal advice. Gate does not guarantee the accuracy or completeness of the information and shall not be liable for any losses arising from the use of this information. Virtual asset investments carry high risks and are subject to significant price volatility. You may lose all of your invested principal. Please fully understand the relevant risks and make prudent decisions based on your own financial situation and risk tolerance. For details, please refer to
Disclaimer.
Related Articles
The HYPE price could surge despite the upcoming $2.8 million short squeeze.
The recent price movements of Hyperliquid (HYPE) are characterized by stagnation around 30 USD. A symmetrical triangle pattern indicates potential for a breakout in either direction, but market sentiment is cautious. Short squeeze risks may boost prices, while weak market flow and deteriorating demand pose challenges. The token could face significant support levels if it dips below 30 USD. An improved market sentiment could lead to a breakout above 33 USD, sparking recovery momentum.
TapChiBitcoin1m ago
Ethereum Price Holds Key Support: Is $2,200 the Next Test for ETH?
March 6, 2026 7:15 pm EST
TheCoinRepublic1h ago
Cardano Price Trends: Bulls Eye Opportunity as Indicator Flashes Green
ADA: Trading near $0.27, facing resistance at $0.28 and support at $0.26.
Technical Indicators: RSI and MACD show weak momentum, signaling short-term consolidation and cautious trading.
Macro Outlook: Rising PMI and historical patterns suggest potential bullish rebound if resistance
CryptoNewsLand2h ago
CryptoQuant: Bitcoin NUPL--MVRV indicator reaches 0.33, or has entered the mid-stage of a bear market
Gate News Announcement, March 7th, CryptoQuant analyst Axel pointed out on the X platform that the Bitcoin NUPL--MVRV harmonic composite indicator has reached 0.33, while historical cycle bottoms typically occur around the 0.5 range. The chart shows that the bear market cycle is beginning to shift upward, indicating that Bitcoin may have entered the mid-stage of this bear market cycle, suggesting that extreme selling conditions are easing. However, this indicator is still well above historical bottom levels, implying that a market-wide bottom has not yet been confirmed.
GateNews2h ago
ZEC Price Analysis: Upcoming Trends and Targets for the Next Few Weeks
ZEC: Stabilized near $200 support, rebounding toward $250 resistance after prolonged bearish pressure.
Technical Indicators: RSI and MACD show gradual improvement, signaling moderate bullish momentum returning.
Market Outlook: Sustained above $240 could push ZEC toward $268, while
CryptoNewsLand3h ago
ZX Squared Capital Founder Warns: Bitcoin May Be in the Deepest Stage of the Bear Market, Could Drop Another 30% in the Future
The founder of American crypto investment firm ZX Squared Capital, CK Zheng, warns that Bitcoin may have entered the deepest phase of a bear market, and the downward trend could intensify in the future. He points out that the market is influenced by four-year cycles, investor sentiment is increasingly volatile, and institutional funds are insufficient to change the market structure. As macroeconomic and geopolitical risks fluctuate, Bitcoin's outlook remains uncertain, and investors need to exercise caution in managing risks.
動區BlockTempo3h ago