Avalanche (AVAX) is currently hovering around the $14.00 mark on Thursday, after two consecutive days of recovery. However, open interest (OI) in AVAX futures contracts remains largely flat below $600 million, reflecting continued investor caution.
According to technical analysis, AVAX is showing signs of leaning towards an uptrend, as indicators suggest that market momentum is gradually shifting after breaking through a key resistance line.
Avalanche lacks interest from retail investors
Avalanche continues to struggle to regain attention from retail investors after a sharp drop on October 10, when open interest (OI) in AVAX futures plunged from $1.45 billion to $645.54 million. As of now, AVAX OI stands at $592.81 million, slightly up from $562.17 million the previous day, indicating that investors remain cautious, mostly “watching and waiting.”
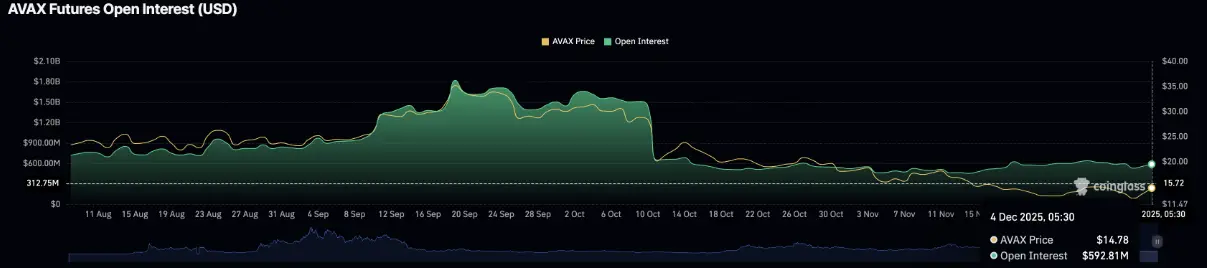 Open interest (OI) in AVAX futures contracts | Source: Coinglass
However, Bitwise’s plan to launch an Avalanche ETF could become a new catalyst if approved by the U.S. Securities and Exchange Commission (SEC), potentially driving demand for AVAX in the near future.
Open interest (OI) in AVAX futures contracts | Source: Coinglass
However, Bitwise’s plan to launch an Avalanche ETF could become a new catalyst if approved by the U.S. Securities and Exchange Commission (SEC), potentially driving demand for AVAX in the near future.
Technical outlook: Will AVAX continue its breakout momentum?
Avalanche (AVAX) has just broken through a short-term resistance trendline formed by the highs of October 13 and November 11 on the daily chart, following two consecutive sessions of recovery. If AVAX maintains its upward momentum and surpasses Friday’s high at $14.77, the price could target the 50-day exponential moving average (EMA) at $17.14.
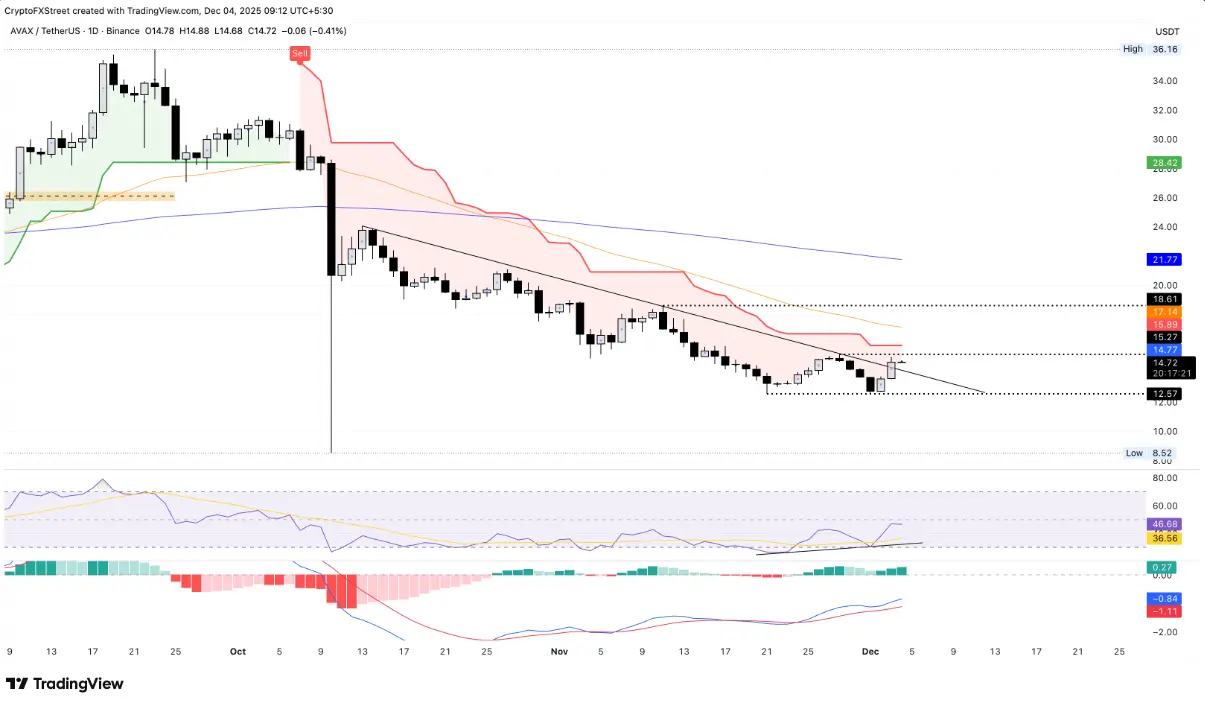 AVAX/USDT daily chart | Source: TradingView
According to the Supertrend indicator, breaking above $15.89 will confirm the start of a new uptrend. The relative strength index (RSI) is at 46 on the daily chart, continuing to reflect a recovery from oversold territory as selling pressure eases. At the same time, the steady increase in RSI during the formation of a double bottom around the November 21 low at $12.57 signals a bullish divergence.
AVAX/USDT daily chart | Source: TradingView
According to the Supertrend indicator, breaking above $15.89 will confirm the start of a new uptrend. The relative strength index (RSI) is at 46 on the daily chart, continuing to reflect a recovery from oversold territory as selling pressure eases. At the same time, the steady increase in RSI during the formation of a double bottom around the November 21 low at $12.57 signals a bullish divergence.
Additionally, the MACD indicator also reinforces this view as the MACD line (green) and the signal line (red) are trending above the 0 line, along with green histogram bars, indicating that bullish momentum still outweighs current bearish pressure.
Conversely, if AVAX fails to break through the $14.77 resistance, the price risks returning to the November 21 low at $12.57.
SN_Nour
Disclaimer: The information on this page may come from third parties and does not represent the views or opinions of Gate. The content displayed on this page is for reference only and does not constitute any financial, investment, or legal advice. Gate does not guarantee the accuracy or completeness of the information and shall not be liable for any losses arising from the use of this information. Virtual asset investments carry high risks and are subject to significant price volatility. You may lose all of your invested principal. Please fully understand the relevant risks and make prudent decisions based on your own financial situation and risk tolerance. For details, please refer to
Disclaimer.
Related Articles
The HYPE price could surge despite the upcoming $2.8 million short squeeze.
The recent price movements of Hyperliquid (HYPE) are characterized by stagnation around 30 USD. A symmetrical triangle pattern indicates potential for a breakout in either direction, but market sentiment is cautious. Short squeeze risks may boost prices, while weak market flow and deteriorating demand pose challenges. The token could face significant support levels if it dips below 30 USD. An improved market sentiment could lead to a breakout above 33 USD, sparking recovery momentum.
TapChiBitcoin13m ago
Ethereum Price Holds Key Support: Is $2,200 the Next Test for ETH?
March 6, 2026 7:15 pm EST
TheCoinRepublic2h ago
Cardano Price Trends: Bulls Eye Opportunity as Indicator Flashes Green
ADA: Trading near $0.27, facing resistance at $0.28 and support at $0.26.
Technical Indicators: RSI and MACD show weak momentum, signaling short-term consolidation and cautious trading.
Macro Outlook: Rising PMI and historical patterns suggest potential bullish rebound if resistance
CryptoNewsLand2h ago
CryptoQuant: Bitcoin NUPL--MVRV indicator reaches 0.33, or has entered the mid-stage of a bear market
Gate News Announcement, March 7th, CryptoQuant analyst Axel pointed out on the X platform that the Bitcoin NUPL--MVRV harmonic composite indicator has reached 0.33, while historical cycle bottoms typically occur around the 0.5 range. The chart shows that the bear market cycle is beginning to shift upward, indicating that Bitcoin may have entered the mid-stage of this bear market cycle, suggesting that extreme selling conditions are easing. However, this indicator is still well above historical bottom levels, implying that a market-wide bottom has not yet been confirmed.
GateNews3h ago
ZEC Price Analysis: Upcoming Trends and Targets for the Next Few Weeks
ZEC: Stabilized near $200 support, rebounding toward $250 resistance after prolonged bearish pressure.
Technical Indicators: RSI and MACD show gradual improvement, signaling moderate bullish momentum returning.
Market Outlook: Sustained above $240 could push ZEC toward $268, while
CryptoNewsLand3h ago