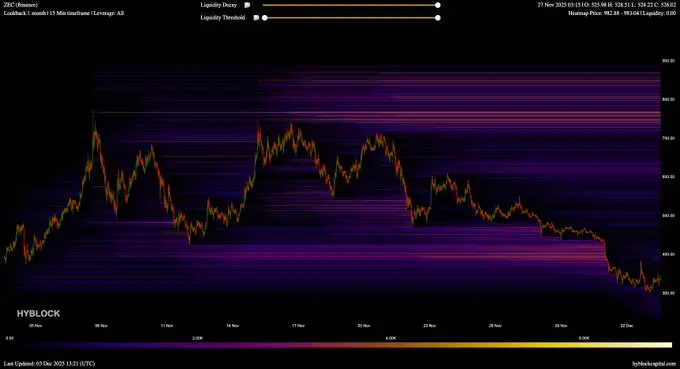
The Zcash (ZEC) market is going through a tough phase as increasing liquidity pressure weighs on the price following an impressive growth cycle earlier this year. Analysts say that market capital flow has shifted from steady buying to continuous selling, and technical signals now clearly reflect this change.
Attempts to break through the previous $380 resistance level have failed, confirming this as a major barrier for ZEC’s price. According to traders, large investors continuously sell whenever the price shows signs of recovery, causing every rally to be blocked and keeping ZEC in a narrow, tense trading range. The price isn’t dropping sharply, but there are also no clear signs of recovery—ZEC is trapped between weakening buying power and aggressive selling.
ZEC Faces Key Resistance $380 —Can Buyers Regain Control?
Analyst Ardi noted on platform X that the “whales” tried to trigger a recovery wave by stepping up buy orders, but heavy liquidation pressure in the market rendered these efforts meaningless. He said there’s a clear imbalance, with nearly three sellers for every buyer.
Ardi also warned that the price area around $380 has become a “trap” for investors hoping for a breakout. Every time the price approaches this level, it attracts new selling, allowing large holders to use short-term rallies to reduce risk.
According to Ardi, ZEC will continue to face risk if it cannot break this resistance. Large buy orders may simply serve as exit liquidity for sellers until the market genuinely reclaims this price level.
In this context, Zcash just underwent a sharp correction, wiping out aggressive long positions in a drop to $300, which helped rebalance the market.
Currently, the technical chart is focused on the key $380 price level. If ZEC can break through and hold above this level, market sentiment will turn positive. The price structure will return to neutral, and early short sellers could be squeezed up to the $420 supply zone.
This price area was previously strong resistance, and if ZEC enters it, it would confirm that buying power has partially regained control. Conversely, if rejected at $380, the downtrend will continue to strengthen.
Below the current price zone is a cluster of dip buyers around $250–$290 —those who entered too early and are still at a loss.
 Ardi’s ZEC Price Prediction ChartThe market often tends to “punish” early accumulators. If ZEC continues to fail at $380, the price may slide lower to flush out the remaining weak long positions.
ZEC Price Forecast: Breaking $430 Could Trigger a Rally to $500
ZEC’s 12-hour chart shows a downtrend after several weeks of strong growth. The trendline supporting the recent rally has been broken, and subsequent rebounds have lacked momentum.
Technical indicators also show hesitation: momentum tools are at low levels with no clear direction. Price volatility has also narrowed within the Bollinger bands after a lengthy decline.
Above the price, the $430–$577 zone remains a major supply area that previously halted ZEC’s parabolic rally. This resistance area hasn’t been retested in the latest rebound, indicating that sellers are still dominant.
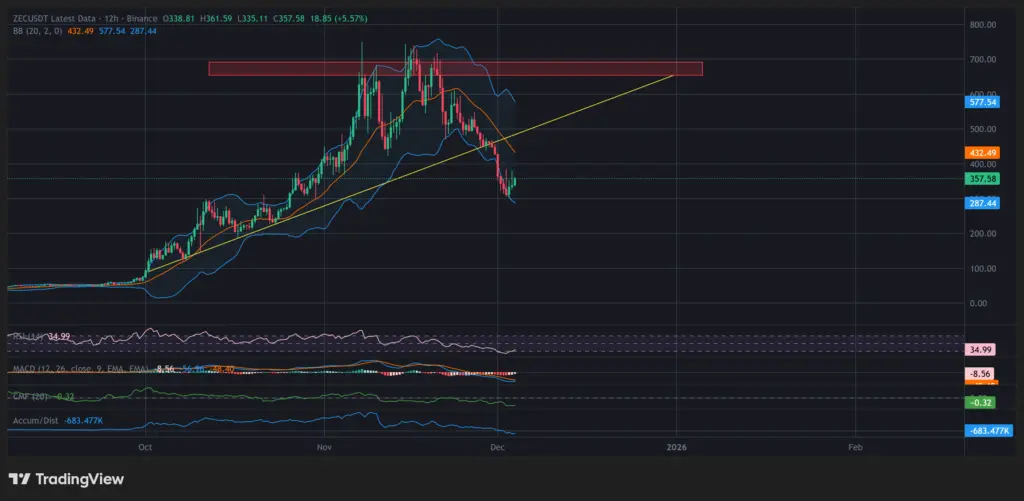 Zcash Price Analysis Chart | Source: TradingViewCurrently, the bears are strongly defending the breakdown zone, with no signs of selling pressure easing.
ZEC’s Fundamental and Technical Outlook: Positive Long-Term Signals
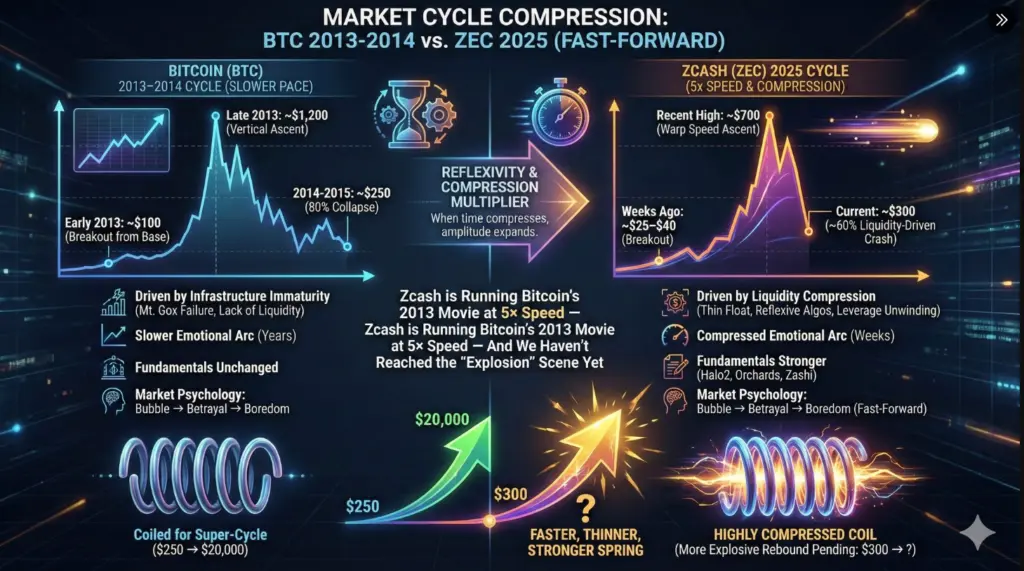
The drop from $700 to $300 for ZEC shares many similarities with Bitcoin’s crash in 2013–2014 but happened much faster. Experts note that both followed a price pattern: base-building, strong breakout, and then correction as liquidity dries up. The rhythm is almost identical—only the speed differs. What took Bitcoin months, ZEC only needed weeks.
However, the reasons behind the price moves are different. Bitcoin crashed due to weak infrastructure and low liquidity at the time, while Zcash’s price drop was mainly due to thin float, rapidly unwinding leveraged positions, and algorithms reacting to a sudden liquidity shock.
Therefore, analysts say this is not a supply issue but a liquidity shock—and such shocks often reverse more quickly.
 Brain Cohen shares the Zcash development roadmap from 2025 onward | Source: XDespite the sharp correction, ZEC’s fundamentals remain solid: the development team continuously delivers updates, the circulating supply is tightening, and interest from the Bitcoin community focused on privacy is growing.
The psychological cycle that took Bitcoin years to play out, ZEC has completed in just a few weeks—suggesting the next major catalyst could arrive sooner than expected.
The last time a similar price structure appeared, Bitcoin rewrote its entire narrative. ZEC watchers believe this scenario is repeating—just at a much faster pace.
Mr. Giao
Disclaimer: The information on this page may come from third parties and does not represent the views or opinions of Gate. The content displayed on this page is for reference only and does not constitute any financial, investment, or legal advice. Gate does not guarantee the accuracy or completeness of the information and shall not be liable for any losses arising from the use of this information. Virtual asset investments carry high risks and are subject to significant price volatility. You may lose all of your invested principal. Please fully understand the relevant risks and make prudent decisions based on your own financial situation and risk tolerance. For details, please refer to
Disclaimer.
Related Articles
AVAX Tests $9.38 Resistance After 8.3% Surge — Breakout or Pullback Ahead?
AVAX is also trading at $9.16 with a daily gain of 8.3 per cent, but still below $9.38 resistance.
Strong buyer activity near $8.46 continues to prevent deeper downside extensions.
A daily close above $9.38 could open room toward $9.50, while rejection risks $8.30.
Avalanche’s
CryptoNewsLandJust Now
XRP Holds $1.34 Support as $1.80–$2.00 Becomes 2025 Make-or-Break Zone
XRP is trading at $1.37 and its trading higher than the support of $1.34 but facing a heavy resistance at $1.38.
The critical structural pivot zone of $1.80-2.00 is the critical 2025 structural pivot.
March structure has the targets of $2.78 and 3.60, with anticipated
CryptoNewsLand6m ago
Dogecoin Prints Monthly Morning Doji Star — Will $0.097 Break Next?
Dogecoin is forming a "Morning Doji Star" pattern on the monthly chart around $0.09, indicating a potential bullish reversal despite a recent 1.9% daily decline. Key support is at $0.09036 and resistance at $0.09707, with current trading at $0.09010.
CryptoNewsLand10m ago
SHIB Faces Critical Breakout Test as Forecast Points to Short-Term 7.47% Gain
Shiba Inu (SHIB) is trading close to the support level of $0.05545, showing a recent decline but also potential for a 7.47% upside by March 2026. The price remains within established boundaries, facing key resistance at $0.055727. Future movements depend on breaking above resistance or falling below support.
CryptoNewsLand59m ago
PEPE Price Coils Within $0.053385–$0.053517 Band as Momentum Stays Balanced
PEPE is trading within a tight range, with support at $0.053385 and resistance at $0.053517. The token shows minimal daily gains and balanced momentum indicators, indicating potential for volatility. Despite limited movement against USDT, PEPE appreciates against BTC and ETH.
CryptoNewsLand1h ago
DXY Breaks Above the Daily 200MA and Crypto Markets Are Watching the ~100 Level Like a Hawk
Currently, the U.S. Dollar Index (DXY) is starting to play a key role in crypto trading this morning. The Dollar has crossed above its Daily 200 period moving averages on March 1, 2026, and is now testing below its Daily 200 period Exponential Moving Averages. Daan Crypto Trades called attention to
BlockChainReporter1h ago