Solana (SOL) recorded a nearly 5% increase at the beginning of the week, right after a Doji candle appeared in Sunday’s session—a signal that often indicates market indecision before a new move. Derivatives data show that the funding rate is edging up, implying that short position holding pressure has significantly decreased. At the same time, Solana ETFs have continued to register net inflows for the sixth consecutive week, reflecting sustained interest from institutional investors.
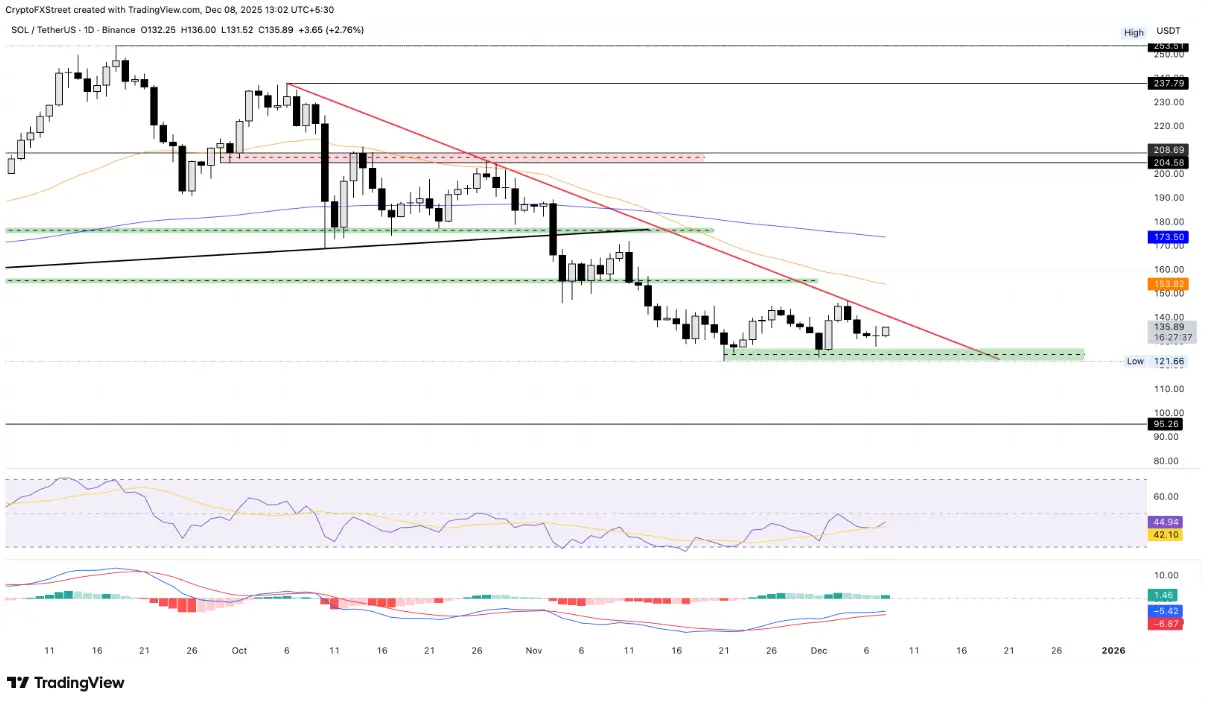
Technically, Solana is now approaching a key resistance area; the trendline that has remained intact since October 6 is becoming a focal point for the market.
Stable demand signals more positive sentiment toward Solana
Open interest (OI) on Solana futures continues to hold above the $7 billion mark, reflecting that capital in the SOL derivatives market is largely moving sideways. According to data from CoinGlass, SOL futures OI reached $7.16 billion on Monday, almost unchanged from 24 hours prior.
The notable point lies in the funding rate: a clear increase indicates that the demand to hold short positions has weakened significantly. The funding rate is currently at -0.0018%, a marked improvement from -0.170% on Sunday. If this indicator turns positive, it will signal that bulls are gaining the upper hand and are willing to pay to maintain long positions.
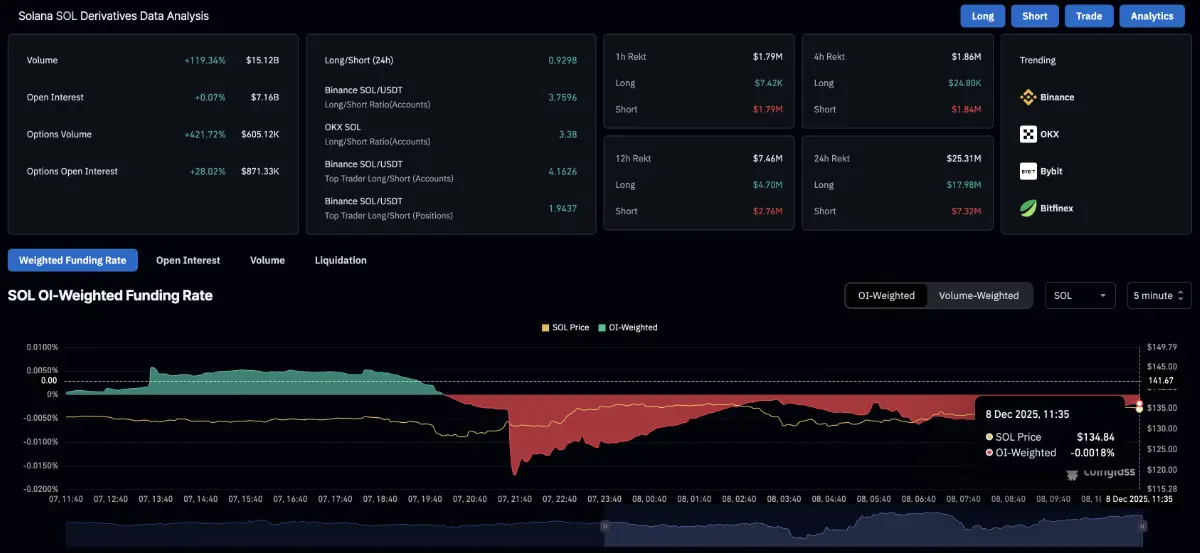 SOL derivatives data | Source: CoinGlass
On the other hand, institutional inflows into Solana have shown signs of slowing, with $20.30 million flowing into SOL ETFs for the week—much lower than the $108.34 million from the previous week. However, Friday alone saw an inflow of $15.68 million, contributing to a six-week streak of positive net inflows into Solana ETFs.
SOL derivatives data | Source: CoinGlass
On the other hand, institutional inflows into Solana have shown signs of slowing, with $20.30 million flowing into SOL ETFs for the week—much lower than the $108.34 million from the previous week. However, Friday alone saw an inflow of $15.68 million, contributing to a six-week streak of positive net inflows into Solana ETFs.
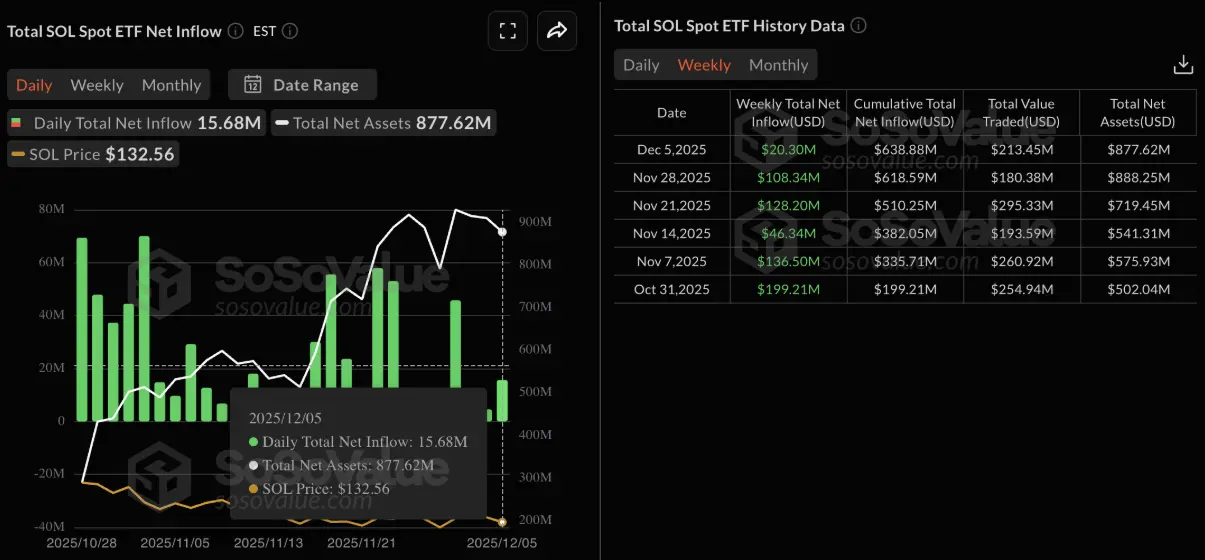 SOL ETF data | Source: Sosovalue
Solana accelerates, aiming to test key resistance line
SOL has continued to trade above the demand zone of $121–127 during Monday’s session, while gradually approaching the resistance line connecting the October 6 and October 27 highs, currently near the $140 mark. If SOL can close a daily candle above this level, the market could see a notable bullish breakout signal.
However, Solana’s upward trajectory still faces two major hurdles: the 50-day EMA at $153 and the 200-day EMA at $173, both of which are sloping downward and may create significant selling pressure.
 SOL/USDT daily chart | Source: TradingView
Technical indicators on the daily timeframe show a clear improvement in trend. The RSI is at 45, leaving ample room to move into the neutral zone, indicating that market sentiment is shifting from bearish to balanced.
SOL/USDT daily chart | Source: TradingView
Technical indicators on the daily timeframe show a clear improvement in trend. The RSI is at 45, leaving ample room to move into the neutral zone, indicating that market sentiment is shifting from bearish to balanced.
At the same time, the MACD line is holding an upward slope above the signal line, reflecting strengthening bullish momentum. However, the narrowing gap between the two lines also suggests a risk of a bearish crossover in the near future.
Conversely, if SOL slips and closes a daily candle below the $121 level, selling pressure could increase sharply, targeting a drop to the April bottom around the $95 mark.
SN_Nour
Disclaimer: The information on this page may come from third parties and does not represent the views or opinions of Gate. The content displayed on this page is for reference only and does not constitute any financial, investment, or legal advice. Gate does not guarantee the accuracy or completeness of the information and shall not be liable for any losses arising from the use of this information. Virtual asset investments carry high risks and are subject to significant price volatility. You may lose all of your invested principal. Please fully understand the relevant risks and make prudent decisions based on your own financial situation and risk tolerance. For details, please refer to
Disclaimer.
Related Articles
Yesterday, the US SOL spot ETF experienced a net outflow of $8,225,500.
According to SoSoValue data, the US SOL spot ETF experienced a net outflow of $8,225,500 on March 6, with the Invesco Galaxy Solana ETF recording a net inflow of $426,900, and the Fidelity Solana Fund ETF recording a net outflow of $4,997,400. Currently, the total net asset value of SOL spot ETFs is $807 million.
GateNews2h ago
The price of Solana may drop sharply after failing to stay above $94.
The Solana (SOL) price chart is showing signs of weakening overall. Currently, the value of this token has decreased by about 10% compared to last month, reflecting a general cooling of the cryptocurrency market. However, this decline masks a noteworthy development. Over the period
TapChiBitcoin2h ago
Yesterday, the US SOL spot ETF experienced a net outflow of $8,225,500, with Fidelity FSOL seeing an outflow of nearly $5 million.
On March 6th, the US SOL spot ETF experienced a net outflow of $8.2255 million, with the Invesco Galaxy Solana ETF seeing a net inflow of $426,900, while the Fidelity Solana Fund ETF had a net outflow of $4.9974 million. The total net asset value is $807 million, with a historical cumulative net inflow of $958 million.
GateNews9h ago
SOL Life increased by 507.92% after launching Alpha, current price is 0.0007232 USDT
Gate News bot message, Gate Market Display, since launching Alpha, SOL has increased by 507.92%, now priced at 0.0007232 USDT.
CryptoRadar9h ago
Solana Price Prediction 2026: Pepeto Targets 267x Over SOL and AVAX as SEC Drops Justin Sun Lawsuit Signaling Enforcement Pivot
The SEC just dropped its lawsuit against Justin Sun with a $10 million settlement from Rainberry, and when the most aggressive crypto enforcement agency in the world starts settling cases and walking away from lawsuits it spent years building, it means the regulatory posture has fundamentally s
CaptainAltcoin15h ago
Ripple Expands Institutional Trading With Coinbase Derivatives BTC, ETH, SOL, and XRP Futures
Ripple added Coinbase BTC, ETH, XRP and SOL futures to Ripple Prime, its platform that cleared more than $3 trillion in 2025.
Trades are processed through Nodal Clear, giving institutions 24/7 access to CFTC-regulated crypto futures in the U.S.
Ripple has added Coinbase Derivatives’
CryptoNewsFlash15h ago