The gold-to-Bitcoin exchange rate has reached a historically rare resistance level. This technical signal has previously triggered parabolic surges in Bitcoin during the 2017 and 2021 bull markets. In 2025, a sharp rise in gold prices has pushed the gold price close to resistance again, while Bitcoin remains range-bound. This divergence is a precursor to capital rotation. Traders are closely watching this ratio because it reflects the market’s choice between safety and growth potential.
Gold-to-Bitcoin Exchange Rate: History Doesn’t Repeat But It Rhymes
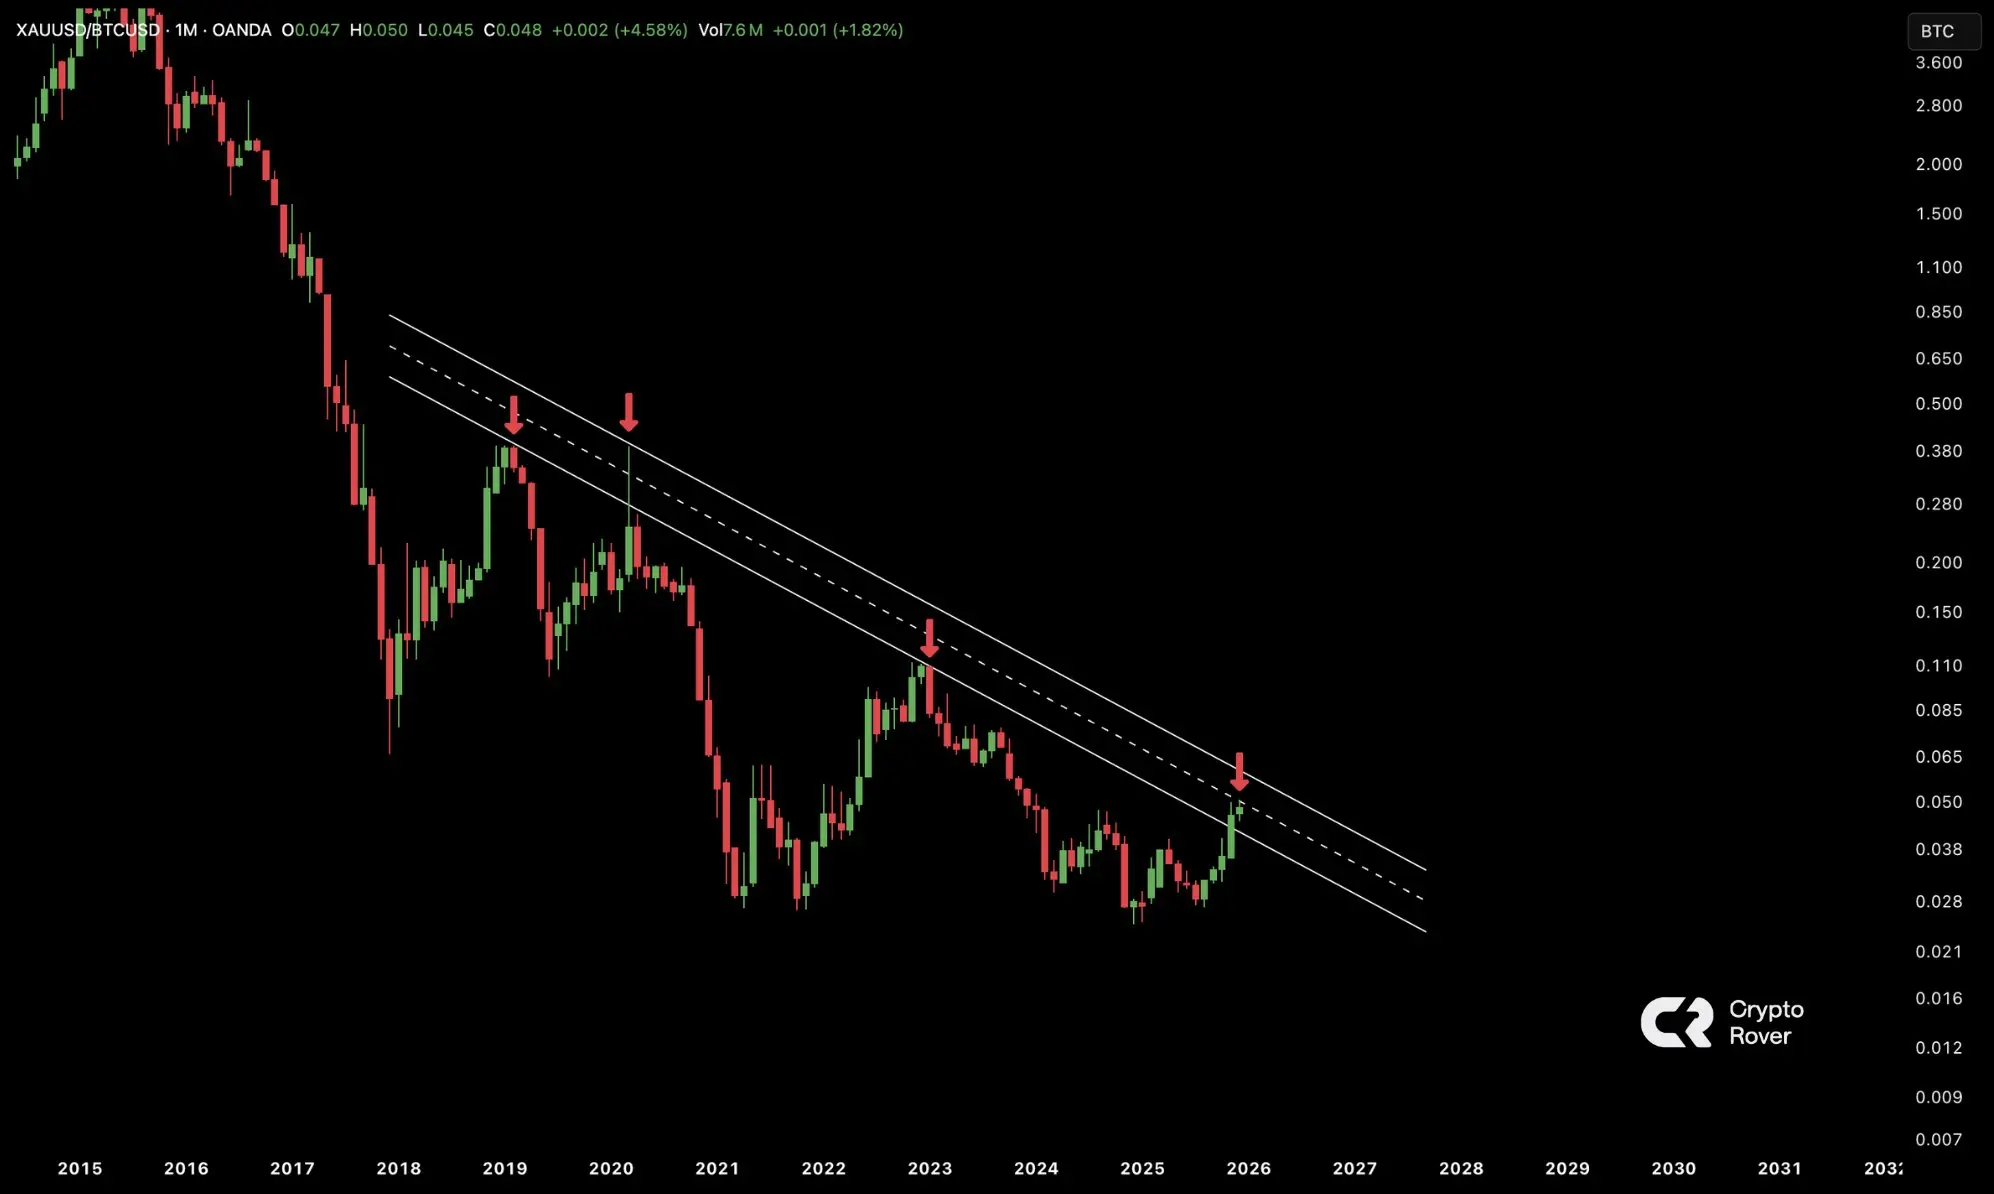
(Source: Crypto Rover)
The price ratio between gold and Bitcoin is one of the purest indicators of market risk appetite. When investors are fearful, capital floods into gold seeking safety, pushing up the gold/Bitcoin ratio. When confidence recovers, funds withdraw from gold and shift into Bitcoin for growth, causing the ratio to decline. This capital rotation pattern has played out repeatedly over the past decade, and the current market structure is at a critical turning point.
The scenario in 2017 is worth a deep review. At that time, gold prices ranged sideways between $1200-$1300, while Bitcoin accelerated from $1000 at the start of the year. After peaking mid-year, the gold/Bitcoin ratio collapsed, and Bitcoin entered an epic bull run, soaring to $20,000 by year-end. The essence of this rally was a massive shift of capital from low-volatility safe assets to high-volatility growth assets.
The script in 2021 is highly similar but on a larger scale. Gold surged to $2070 at the start of the pandemic before beginning to decline, while Bitcoin continued its ascent from $29,000 at the end of 2020. The gold/Bitcoin ratio reached a relative high early in 2021 and then quickly fell. Bitcoin then launched its final wave, reaching a historic high of $69,000 in November. Both historical experiences confirm the same logic: after the ratio peaks, a collapse often accompanies explosive Bitcoin gains.
The current 2025 scenario presents a third similar structure. Gold prices soared sharply amid geopolitical tensions and inflation fears, while Bitcoin remains range-bound between $90,000 and $110,000. This divergence is pushing the gold/Bitcoin ratio back toward historic resistance levels. The market is repeating past patterns, but the participant structure has changed. In 2017, retail investors drove the move; in 2021, institutions began participating; and by 2025, institutions, ETFs, and sovereign funds are entering in full force.
Three Levels of Risk Appetite Shift
The capital shift from gold to Bitcoin is not merely speculative but reflects a deep change in market risk appetite. This transformation can be understood on three levels.
Drivers of the Gold/Bitcoin Ratio Reversal
Liquidity Environment Improvement: Easing interest rate expectations, central bank policy shifts toward easing, reduce the opportunity cost of holding zero-yield gold.
Revaluation of Risk Assets: Institutional recognition of Bitcoin as “digital gold” increases; ETF offerings provide compliant channels, lowering entry barriers.
Technical Breakthrough Expectations: Bitcoin has been range-bound long enough, with sufficient chip turnover; once a breakout occurs, FOMO effects will be triggered.
The first level is macro liquidity. When interest rates are high, holding zero-yield gold becomes less attractive, and funds tend toward fixed-income assets. But when rate cut expectations rise or actual cuts begin, the opportunity cost of holding gold decreases, easing constraints on risk assets. Historical data shows that the early phase of a rate-cut cycle is often when gold performs best, but as the cycle deepens, capital gradually shifts toward higher-beta assets like stocks and cryptocurrencies.
The second level is institutional attitude. Over recent years, mainstream financial institutions’ views on Bitcoin have undergone a fundamental shift. From “scam” to “alternative asset” to “digital gold,” this evolution of perception has led many institutions that previously only held physical gold to consider Bitcoin. The launch of spot ETFs is especially critical, providing a compliant and convenient channel for institutional allocation, significantly lowering the entry barrier.
The third level is technical and market structure. The longer Bitcoin consolidates at high levels, the more thorough the chip turnover, and the more explosive the breakout tends to be. Currently, Bitcoin has been consolidating in the $90,000-$110,000 range for months, while gold continues to hit new highs. This divergence is accumulating enormous elastic potential. Once market sentiment shifts, long-suppressed buying pressure may surge.
Unique Variables and Trading Strategies in 2025
The market structure in 2025 differs significantly from the past. Gold’s strength this year is mainly driven by central bank purchases and geopolitical safe-haven demand, rather than traditional inflation hedging. This means gold’s support is more from structural demand than cyclical factors. However, this does not prevent tactical rotation of capital between gold and Bitcoin.
The range-bound consolidation of Bitcoin also has constructive implications. Despite limited price volatility in recent months, on-chain activity, institutional holdings, and ETF capital inflows have remained stable. This “price stagnant, fundamentals improving” combination often signals a higher likelihood of an upward breakout. When the gold/Bitcoin ratio falls back from resistance, it will be a moment for Bitcoin to regain market attention.
Traders are not chasing expectations but following the established structure. The technical signals of the ratio are clear; in this scenario, a decline in the ratio favors Bitcoin. Once a breakout is confirmed, the market usually reacts swiftly. Volatility will follow, which is exactly the environment trend traders look forward to. Historical patterns show that when the ratio collapses from resistance, Bitcoin’s gains are often multiples or even dozens of times those of gold.
The current market is at a critical decision point. The gold-to-Bitcoin ratio has hit a historic resistance level; similar situations in the past have triggered explosive Bitcoin rallies. Although history does not repeat exactly, the similarity in market structure warrants close attention. For allocation-focused investors, this is an important moment to assess the relative allocation between gold and Bitcoin. For traders, the technical signals of the ratio provide a clear risk-reward framework.
Disclaimer: The information on this page may come from third parties and does not represent the views or opinions of Gate. The content displayed on this page is for reference only and does not constitute any financial, investment, or legal advice. Gate does not guarantee the accuracy or completeness of the information and shall not be liable for any losses arising from the use of this information. Virtual asset investments carry high risks and are subject to significant price volatility. You may lose all of your invested principal. Please fully understand the relevant risks and make prudent decisions based on your own financial situation and risk tolerance. For details, please refer to
Disclaimer.
Related Articles
Ethereum Price Holds Key Support: Is $2,200 the Next Test for ETH?
March 6, 2026 7:15 pm EST
TheCoinRepublic1h ago
Cardano Price Trends: Bulls Eye Opportunity as Indicator Flashes Green
ADA: Trading near $0.27, facing resistance at $0.28 and support at $0.26.
Technical Indicators: RSI and MACD show weak momentum, signaling short-term consolidation and cautious trading.
Macro Outlook: Rising PMI and historical patterns suggest potential bullish rebound if resistance
CryptoNewsLand1h ago
CryptoQuant: Bitcoin NUPL--MVRV indicator reaches 0.33, or has entered the mid-stage of a bear market
Gate News Announcement, March 7th, CryptoQuant analyst Axel pointed out on the X platform that the Bitcoin NUPL--MVRV harmonic composite indicator has reached 0.33, while historical cycle bottoms typically occur around the 0.5 range. The chart shows that the bear market cycle is beginning to shift upward, indicating that Bitcoin may have entered the mid-stage of this bear market cycle, suggesting that extreme selling conditions are easing. However, this indicator is still well above historical bottom levels, implying that a market-wide bottom has not yet been confirmed.
GateNews2h ago
ZEC Price Analysis: Upcoming Trends and Targets for the Next Few Weeks
ZEC: Stabilized near $200 support, rebounding toward $250 resistance after prolonged bearish pressure.
Technical Indicators: RSI and MACD show gradual improvement, signaling moderate bullish momentum returning.
Market Outlook: Sustained above $240 could push ZEC toward $268, while
CryptoNewsLand2h ago
ZX Squared Capital Founder Warns: Bitcoin May Be in the Deepest Stage of the Bear Market, Could Drop Another 30% in the Future
The founder of American crypto investment firm ZX Squared Capital, CK Zheng, warns that Bitcoin may have entered the deepest phase of a bear market, and the downward trend could intensify in the future. He points out that the market is influenced by four-year cycles, investor sentiment is increasingly volatile, and institutional funds are insufficient to change the market structure. As macroeconomic and geopolitical risks fluctuate, Bitcoin's outlook remains uncertain, and investors need to exercise caution in managing risks.
動區BlockTempo3h ago
Dogecoin Price Jumps as Derivatives Demand Signals Breakout
Key Insights
Dogecoin surged to a weekly high of $0.103 as improving market sentiment and strong derivatives demand encouraged traders to position for further gains.
Futures data from CoinGlass showed a positive funding rate, indicating long traders are paying premiums while positioning for
CryptoFrontNews3h ago