Date: Sat, Dec 20 2025 | 07:20 AM GMT
The broader cryptocurrency market has been stuck in a choppy and fragile phase over the past several weeks, a trend that started after the sharp sell-off on October 10. That correction dragged Ethereum (ETH) down by nearly 26% over the last 60 days and kept sustained pressure on most major altcoins. Avalanche (AVAX) has been no exception to this move, remaining firmly under bearish control for much of the period.
AVAX has declined by more than 37% over the past two months, reflecting persistent selling pressure and weak sentiment. However, a closer look at the chart suggests that price action may be transitioning into a more constructive phase. While the short-term trend is still negative, the broader structure is beginning to resemble a potential reversal setup that traders often associate with market bottoms.
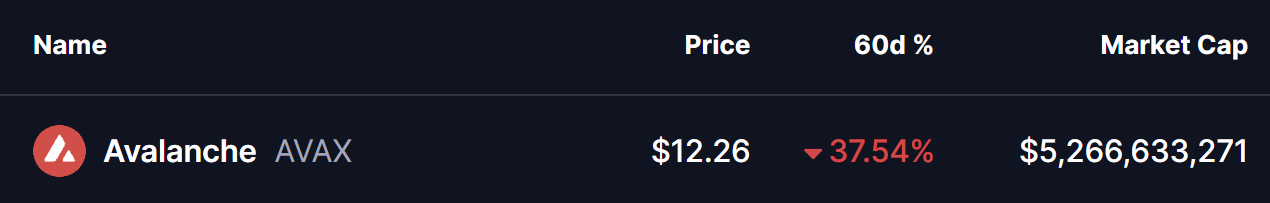
Source: Coinmarketcap
Power of 3 Structure Begins to Take Shape
On the higher-timeframe chart, AVAX appears to be developing a classic Power of 3 formation. This structure typically unfolds in three distinct stages: accumulation, manipulation, and expansion. When it appears near extended downtrends, it can sometimes hint that a larger directional move is approaching.
Earlier in the year, AVAX spent a prolonged period moving sideways within a clearly defined range. Price oscillated between resistance near the $14.82 area and support around $12.74, as highlighted by the gray consolidation zone on the chart. This phase reflected accumulation, where volatility compressed and directional conviction faded. Such conditions often emerge when selling pressure slows and longer-term participants quietly position while retail interest remains subdued.
That calm phase eventually gave way to a sharp breakdown. As broader market weakness intensified, AVAX lost the $12.74 support and slid aggressively lower, reaching a recent low near $11.26. This sudden drop aligns closely with the manipulation phase of the Power of 3 pattern. Moves like this are often marked by heightened fear, stop-loss hunting, and forced liquidations, pushing sentiment to pessimistic extremes.
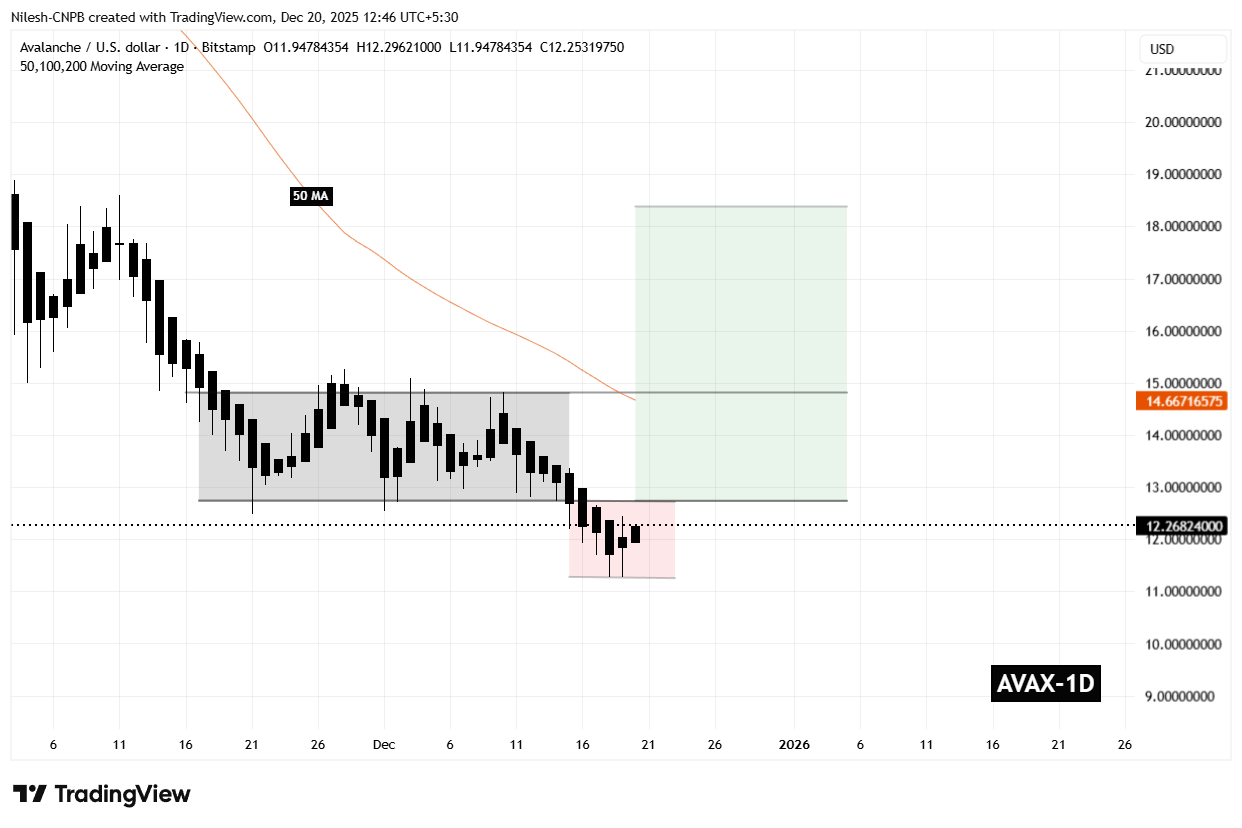
Avalanche (AVAX) Daily Chart/Coinsprobe (Source: Tradingview)
Importantly, downside momentum has started to cool near this lower region. Recent candles show tighter ranges and reduced follow-through, suggesting that selling pressure may be losing strength. This stabilization does not confirm a reversal on its own, but it does indicate that the market may be searching for a base.
What’s Next for AVAX?
At present, AVAX remains trapped near the lower boundary of its recent range, with price hovering around the $12 zone. A period of consolidation at these levels would be consistent with the transition phase that often follows sharp breakdowns. Bulls will need to see clear evidence of strength before confidence can return.
For a bullish reversal narrative to gain credibility, AVAX must reclaim the $12.74 level. A sustained move back above this former support would signal that price has re-entered the prior accumulation range, increasing the probability that the manipulation phase has run its course. From there, a breakout above the $14.82 resistance would mark a shift into the expansion phase of the Power of 3 structure, where upside momentum can accelerate rapidly.
If that breakout occurs, the chart projection points toward the $18.38 region as a potential upside objective. This zone aligns with previous structural resistance and represents a meaningful recovery from current levels.
That said, the setup remains highly conditional. As long as AVAX continues to trade below $12.74, downside risks remain on the table, and further volatility cannot be ruled out. Holding the recent lows and reclaiming key resistance levels will be crucial for bulls looking to confirm that a broader trend reversal is underway.
Disclaimer: The views and analysis presented in this article are for informational purposes only and reflect the author’s perspective, not financial advice. Technical patterns and indicators discussed are subject to market volatility and may or may not yield the anticipated results. Investors are advised to exercise caution, conduct independent research, and make decisions aligned with their individual risk tolerance.
Disclaimer: The information on this page may come from third parties and does not represent the views or opinions of Gate. The content displayed on this page is for reference only and does not constitute any financial, investment, or legal advice. Gate does not guarantee the accuracy or completeness of the information and shall not be liable for any losses arising from the use of this information. Virtual asset investments carry high risks and are subject to significant price volatility. You may lose all of your invested principal. Please fully understand the relevant risks and make prudent decisions based on your own financial situation and risk tolerance. For details, please refer to
Disclaimer.