Date: Thu, Dec 18, 2025 | 07:10 AM GMT
The broader cryptocurrency market has been experiencing choppy price action over the past several weeks, a phase that began after the sharp sell-off on October 10. That correction dragged Ethereum (ETH) down by nearly 22% over the last 60 days, keeping pressure firmly on major altcoins — including Avalanche (AVAX).
AVAX has slipped more than 12% over the past week alone, extending its 60-day decline to over 41%. While the short-term trend remains weak, a closer look at the higher-timeframe chart suggests that the sell-off may be approaching an area where downside momentum starts to fade.
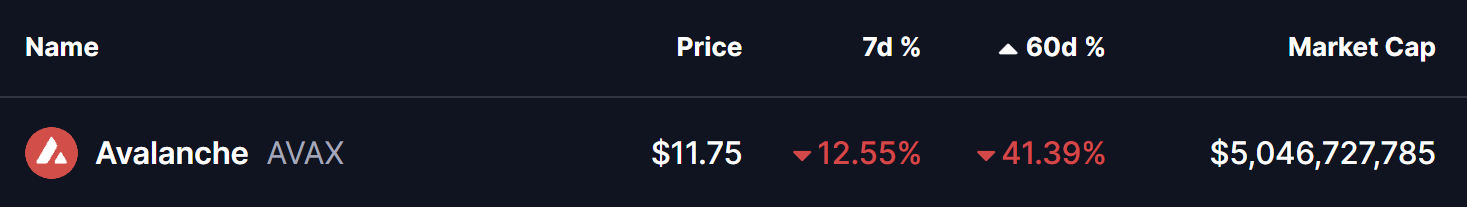
Source: Coinmarketcap
Falling Wedge Pattern in Play
On the weekly chart, AVAX continues to trade inside a well-defined falling wedge pattern. This structure has been guiding price action since early 2024 and is characterized by lower highs and lower lows that gradually compress into a narrowing range. Historically, falling wedges often reflect slowing selling pressure rather than aggressive distribution.
As shown on the chart, the latest decline has pushed AVAX directly into the lower boundary of this wedge, near the $11.64 region. This zone has acted as a critical demand area in the past, repeatedly attracting buyers and triggering short-term rebounds. Once again, price is reacting near this level, suggesting that sellers may be losing strength as AVAX presses into long-term support.
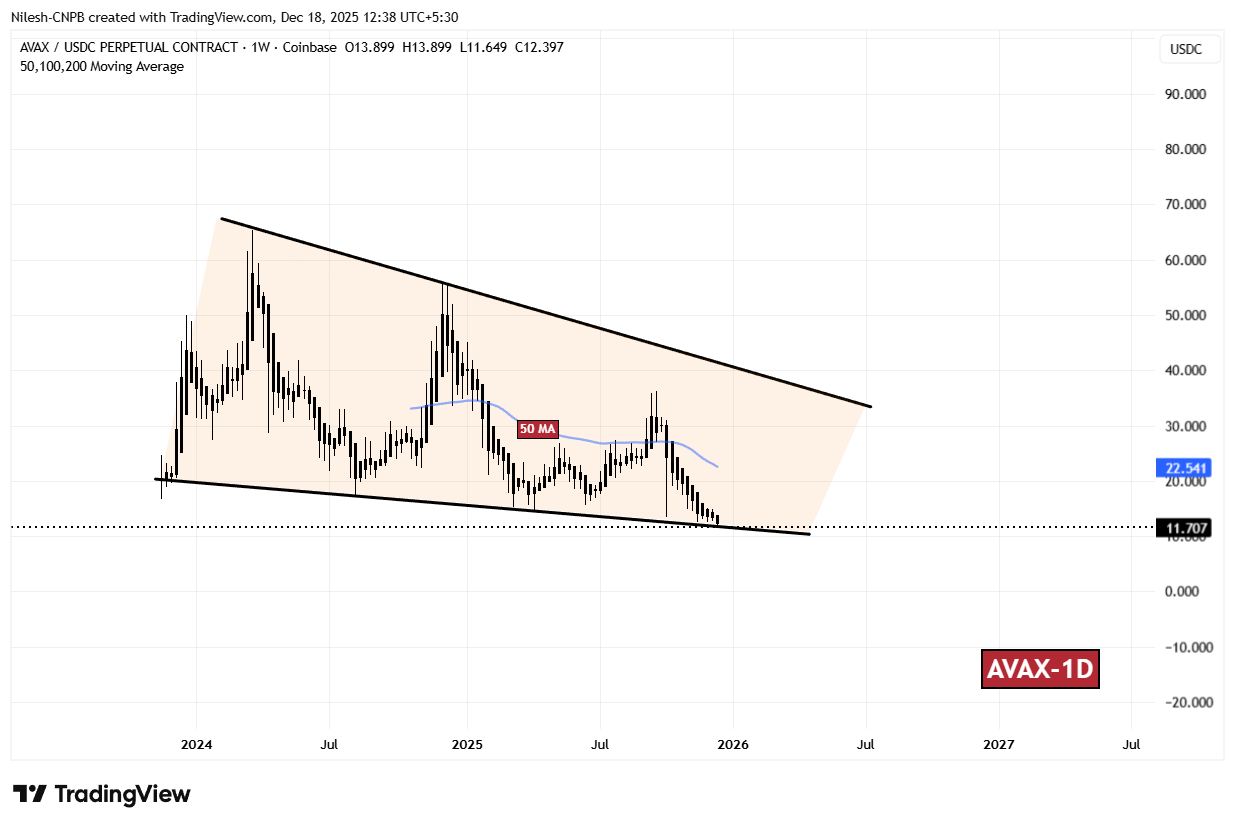
AVAX Weekly Chart/Coinsprobe (Source: Tradingview)
The repeated defenses of the wedge’s lower trendline, combined with shrinking downside follow-through, point to growing indecision rather than panic selling. This behavior often precedes a stabilization phase or a relief bounce.
What’s Next for AVAX?
If AVAX continues to hold above the wedge floor, the focus will shift to whether buyers can reclaim key overhead levels. The first major hurdle sits at the 50-week moving average, currently near $22.54. This level has consistently acted as dynamic resistance during prior recovery attempts and remains a key marker for any trend change.
A sustained move above this moving average would strengthen the bullish case and potentially open the door for a push toward the upper boundary of the falling wedge. Reaching that zone would signal a meaningful shift in market structure and sentiment.
That said, the setup remains conditional. A decisive weekly close below the wedge’s lower boundary would invalidate the pattern and expose AVAX to further downside risk, with the next notable support area emerging near the $9.00 level.
For now, AVAX sits at a technically important crossroads. While broader market conditions remain fragile, the compression within this falling wedge suggests that a larger move may be approaching — with the coming weeks likely to determine whether this support zone becomes a base for recovery or a stepping stone to deeper losses.
Disclaimer: The views and analysis presented in this article are for informational purposes only and reflect the author’s perspective, not financial advice. Technical patterns and indicators discussed are subject to market volatility and may or may not yield the anticipated results. Investors are advised to exercise caution, conduct independent research, and make decisions aligned with their individual risk tolerance.
Disclaimer: The information on this page may come from third parties and does not represent the views or opinions of Gate. The content displayed on this page is for reference only and does not constitute any financial, investment, or legal advice. Gate does not guarantee the accuracy or completeness of the information and shall not be liable for any losses arising from the use of this information. Virtual asset investments carry high risks and are subject to significant price volatility. You may lose all of your invested principal. Please fully understand the relevant risks and make prudent decisions based on your own financial situation and risk tolerance. For details, please refer to
Disclaimer.
Related Articles
Will XRP Hold $1.33 or Extend Toward $1.30 Before Rebound?
XRP is currently trading at $1.35, experiencing a 1.3% decline. Key support is at $1.34, while resistance is at $1.40. The price is testing around the Fibonacci levels of $1.33 and $1.30, crucial for potential upward movement or deeper decline.
CryptoNewsLand3h ago
Dogecoin Monthly Breakdown Pattern Reappears as Price Tests $0.0918
Dogecoin is currently trading at $0.09205 at a gain of 2.3, with support of above $0.08878.
As can be seen in the monthly chart, there are recurring breakdown areas that have been followed by significant expansions in price.
The short-term trading range is narrow and the immediate point o
CryptoNewsLand3h ago
Solana Nears $95 Resistance With $17B Volume Surge
Solana approaches a key resistance level near $95, with increased trading volume and open interest signaling active trader interest. The token is currently at $90.20, facing potential upward movement if it surpasses $95, but may test $85 if rejected.
CryptoFrontNews4h ago
Bitcoin Slips to $68,000 as Middle East Conflict and US Jobs Data Trigger Sell-Off
Bitcoin surrendered its $70,000 support level, triggering a broader crypto market retreat that wiped out $329 million in leveraged positions. This downturn was fueled by a perfect storm of geopolitical and macroeconomic pressures.
Wiping out the ‘War Gains’
Bitcoin’s midweek resilience
Coinpedia4h ago
PEPE Hovers at Critical $0.053414 Support as $432M Volume Surge Tightens Breakout Watch
PEPE is trading at $0.053416, just above support at $0.053414, with significant trading volume up 22.14%. Resistance is at $0.053676. Despite a slight decrease in price, there’s increased market activity, suggesting potential volatility.
CryptoNewsLand4h ago
DXY Retest at 99.183: Will 100–101 Break as US Degen Index Stabilizes?
DXY trades at 99.183 while retesting the 100–101 monthly resistance zone.
US Degen Index 6900 sits at $0.0001197 with support at $0.0001175 and resistance at $0.0001214.
A break above 101 on DXY would shift structure higher, while rejection keeps price below key resistance.
The U.
CryptoNewsLand4h ago