Hedera (HBAR) faces prolonged downward pressure over the past two months, reflecting a general weakening trend in the cryptocurrency market. The HBAR price has continuously plummeted as risk appetite declines and capital shifts toward defensive assets.
Although it has just experienced sharp declines, the current market structure indicates that January could become a significant turning point for this altcoin’s growth momentum.
HBAR Price History: The Numbers That Speak
January is always considered the most favorable period for HBAR’s performance. Over more than seven years of trading history, this token has recorded an average January return of 38%, with a median return of 19.7%. These figures demonstrate stable seasonal strength, not just short-term rallies.
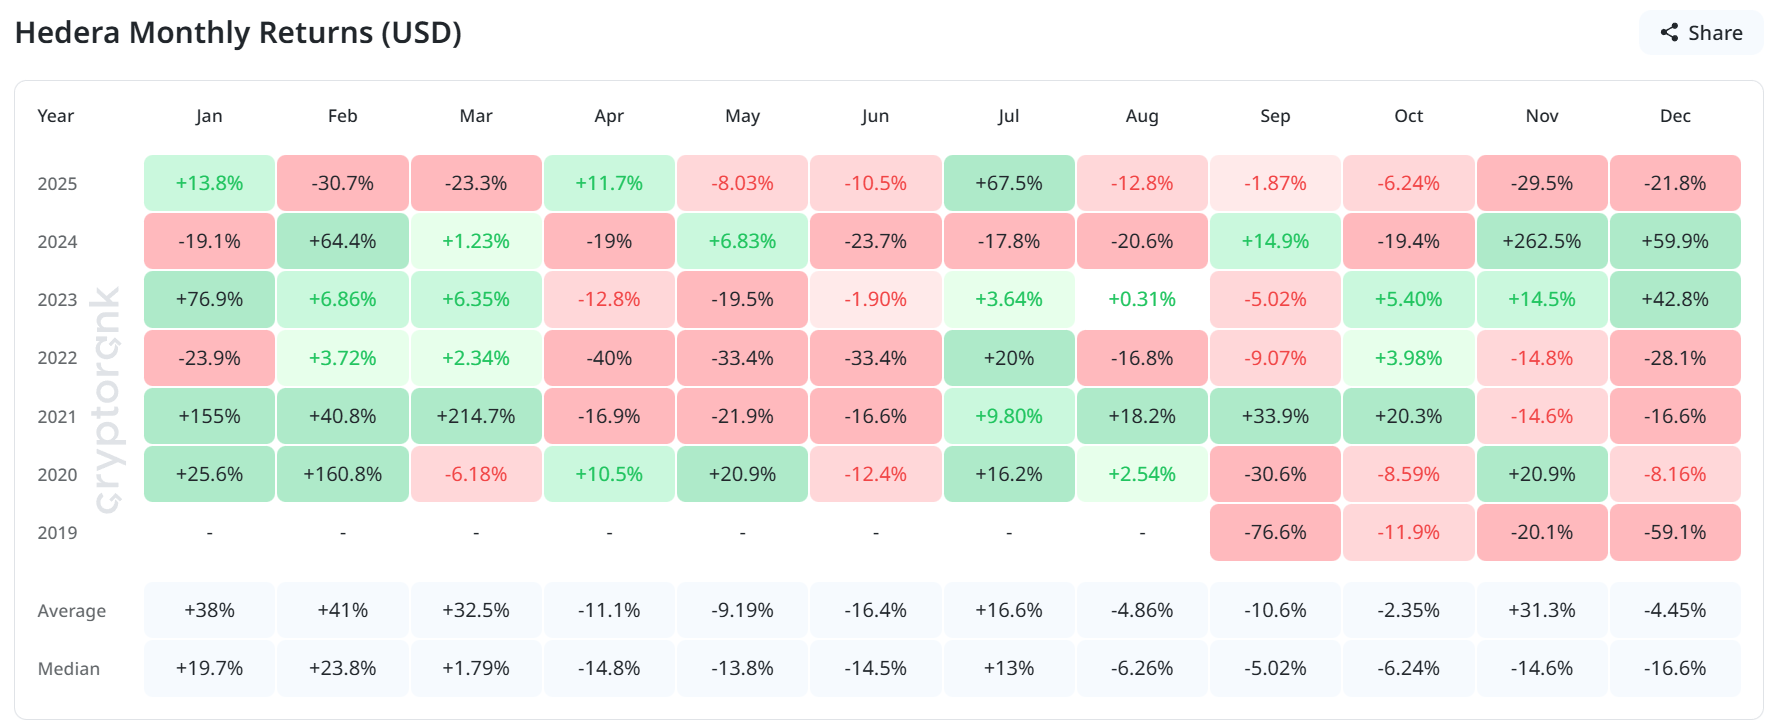 Monthly Profit History of HBAR | Source: CryptoRankData on seasonality still holds significant importance for long-term investors. If historical trends repeat, HBAR could welcome a new wave of buying right at the start of 2026. This is also when traders often rebalance their portfolios, seeking undervalued assets after a prolonged downtrend.
Market Sentiment: Hedera Investors Lean Toward a Downtrend
Derivatives data shows cautious sentiment and a somewhat bearish bias within the Hedera trading community. The short position on the futures market currently stands at around $4.30 million, while actual short volume is lower, approximately $3.16 million. This reflects an imbalance, with expectations that prices will continue to decline.
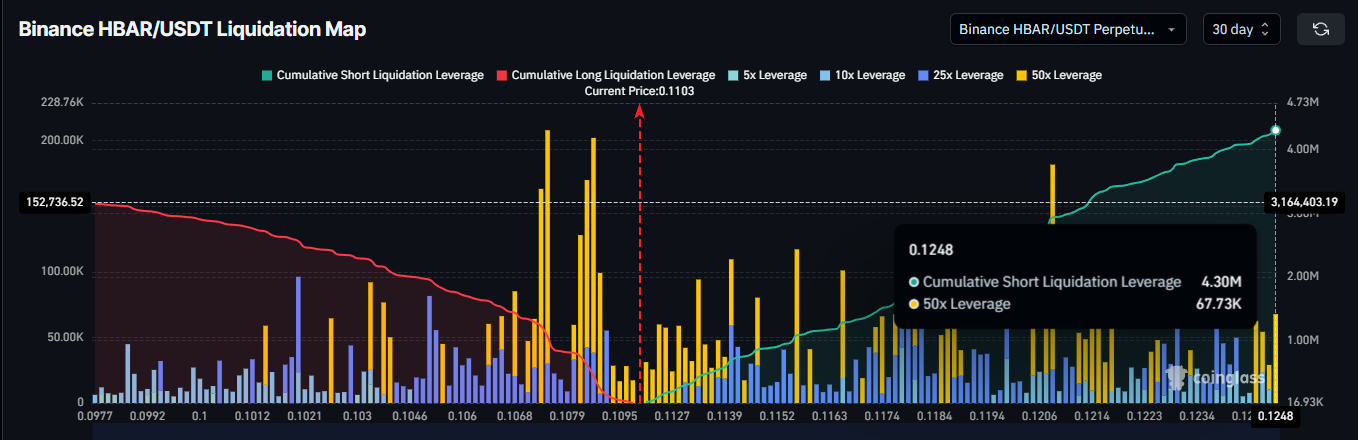 HBAR Liquidation Map | Source: CoinglassThis position indicates traders are not fully confident that prices will stabilize at the current levels. Typically, when a price decline is forecasted, short positions tend to expand. Although leverage increases volatility, the current market structure remains more pessimistic than risk-averse and optimistic.
Bitcoin Leading the Overall Trend
HBAR maintains a strong correlation with Bitcoin, with a current coefficient of 0.89. This relationship has become more evident in recent sessions, indicating that Hedera’s price movements largely depend on the overall trend of the cryptocurrency market. This further confirms Bitcoin’s leading role in driving short-term momentum for major altcoins.
This correlation presents both opportunities and risks. If Bitcoin recovers, HBAR is likely to grow alongside other large-cap altcoins. Conversely, if Bitcoin continues to weaken, Hedera’s independent recovery potential will be limited.
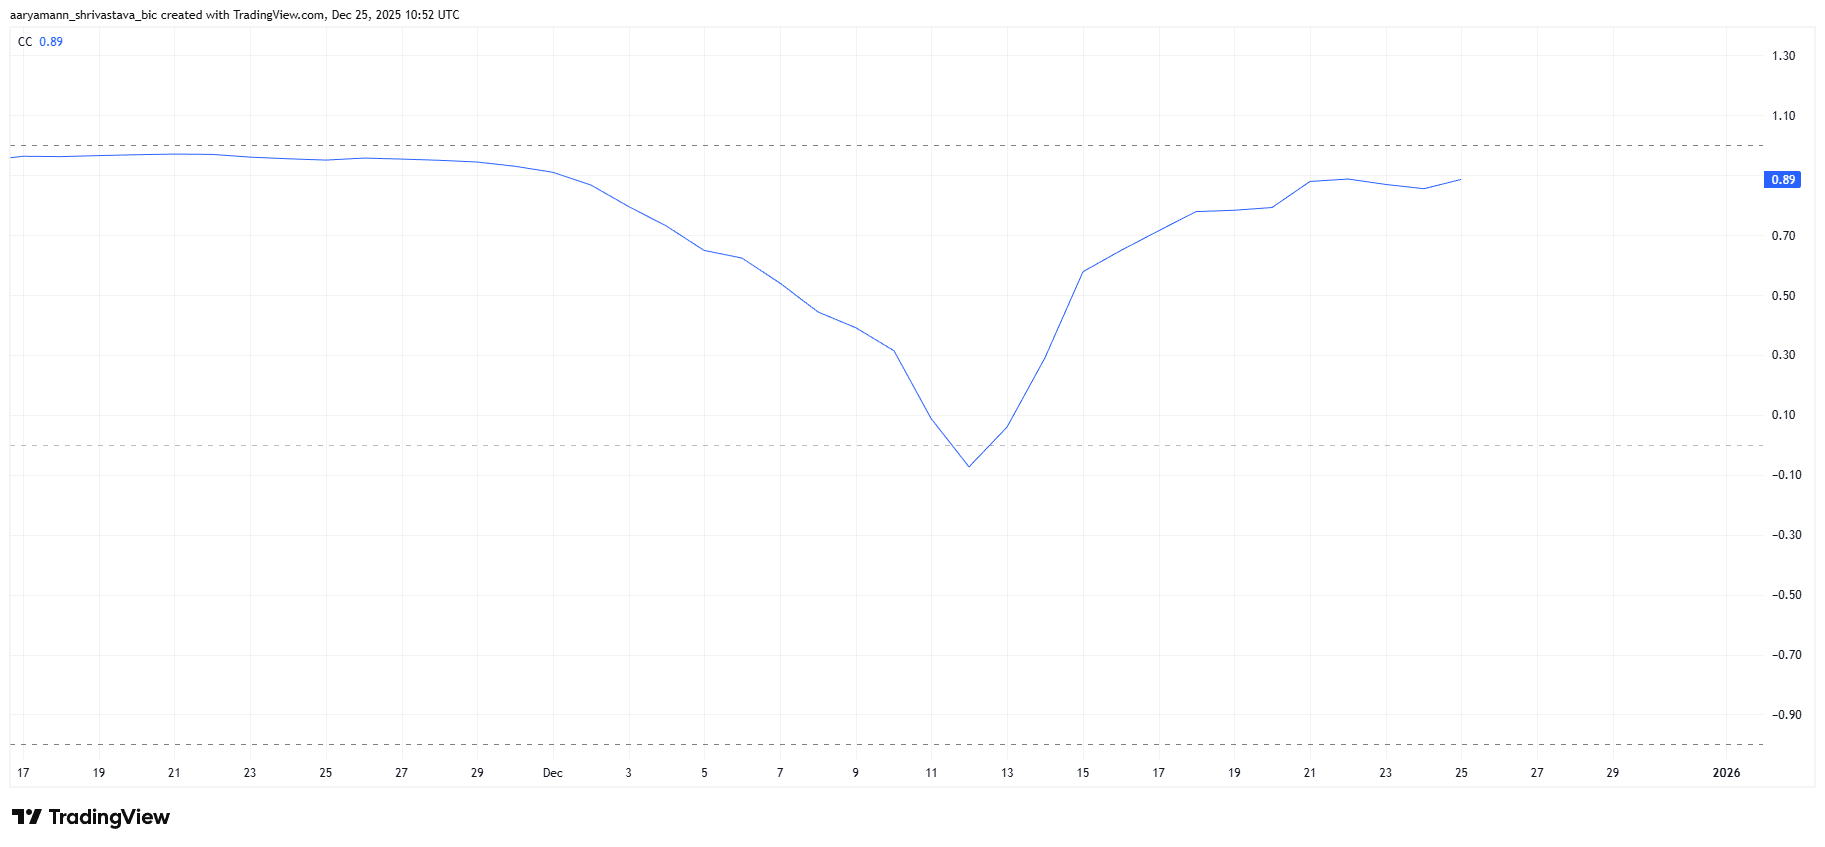 Correlation Between HBAR and Bitcoin | Source: TradingViewTherefore, macroeconomic factors remain crucial. As long as Bitcoin maintains key support levels, HBAR can benefit from positive spillover effects. However, any deep correction in Bitcoin will exert strong pressure on Hedera’s price structure.
Recovery Outlook: Can HBAR Reclaim Key Support Levels?
At the time of writing, HBAR is trading around $0.110, still constrained below the 23.6% Fibonacci retracement level (from the peak of $0.155 to the trough of $0.102). Although a rebound from this zone is possible, the current bullish momentum is weak and slow.
A deeper correction may be needed to accumulate strength. If the price retreats to the psychological level of $0.100, buying interest could increase significantly, as liquidity tends to concentrate around round numbers. When the price remains below the $0.112–$0.115 range, trading activity mainly reflects distribution rather than accumulation.
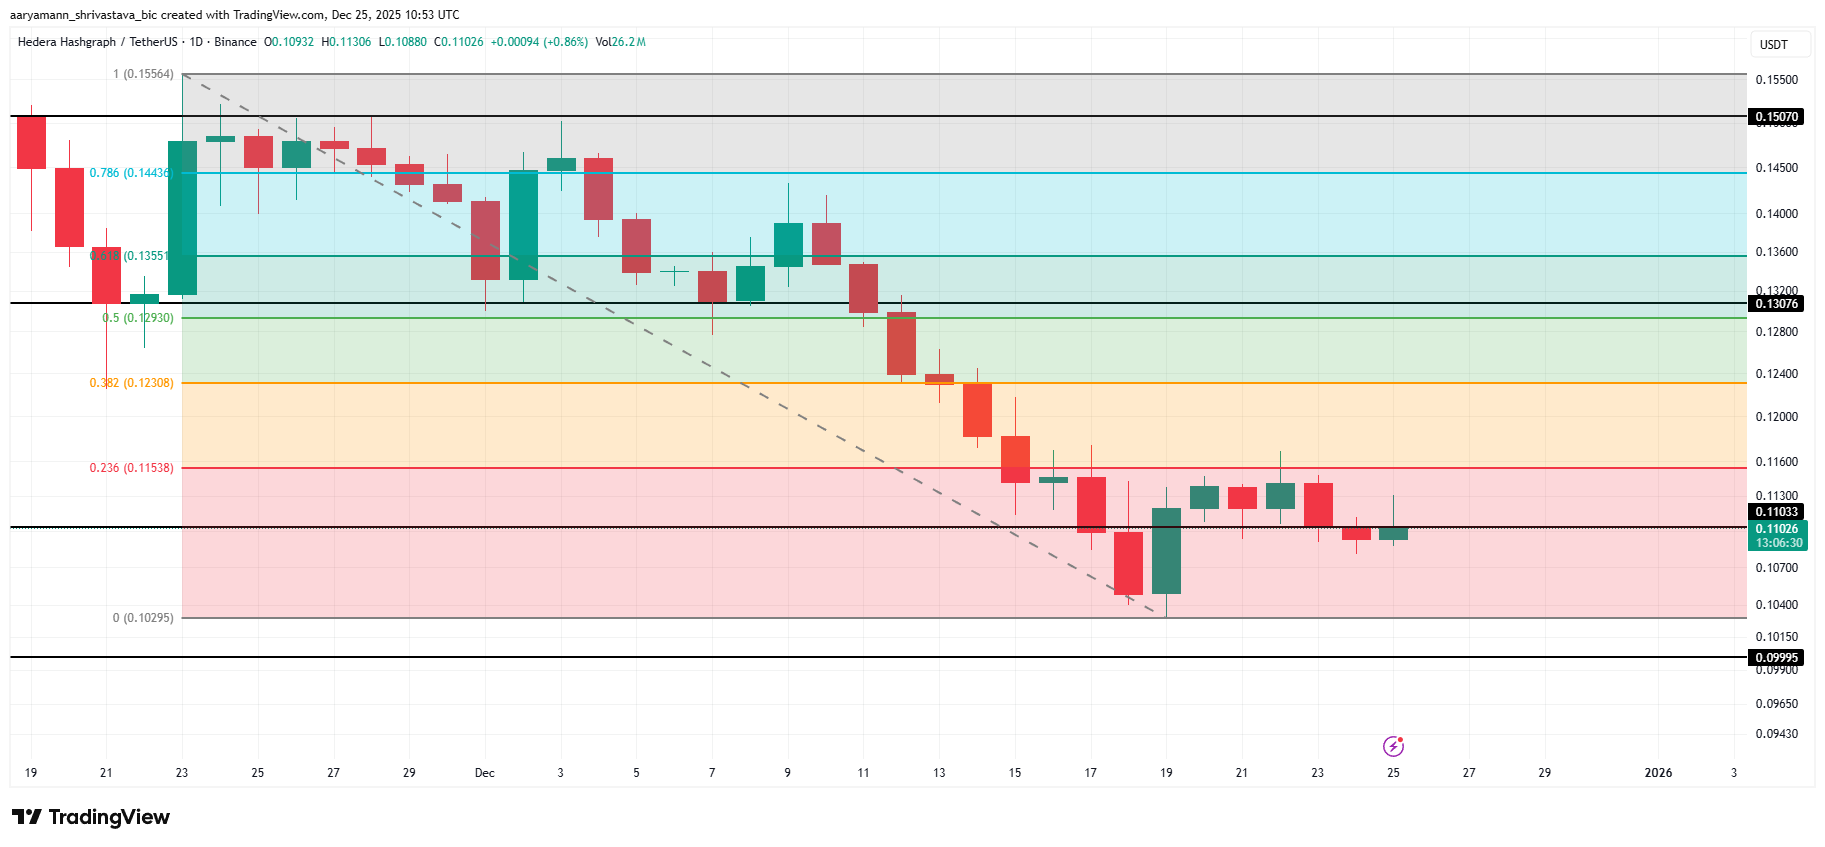 HBAR Price Analysis | Source: TradingViewIf buying interest returns, the first target will be to reclaim the 23.6% Fibonacci level at $0.115 to establish a support zone. If successful, HBAR could aim for the $0.130 range in January. Conversely, if bullish momentum weakens or Bitcoin drops sharply, HBAR could fall below $0.100, risking a decline toward $0.099 or lower, thereby negating the previous bullish outlook.
Disclaimer: The information on this page may come from third parties and does not represent the views or opinions of Gate. The content displayed on this page is for reference only and does not constitute any financial, investment, or legal advice. Gate does not guarantee the accuracy or completeness of the information and shall not be liable for any losses arising from the use of this information. Virtual asset investments carry high risks and are subject to significant price volatility. You may lose all of your invested principal. Please fully understand the relevant risks and make prudent decisions based on your own financial situation and risk tolerance. For details, please refer to
Disclaimer.
Related Articles
Expert Claims Altcoin Metrics Are Being 'Gamed' to Mislead Investors
Crypto researcher Orbion raises concerns over the possible manipulation of key market indicators, including the Altseason Index and Crypto Fear and Greed Index, suggesting that inflated metrics create false optimism and mislead investors about the onset of altcoin season.
Coinpedia42m ago
XRP Holds $1.34 Support as $1.80–$2.00 Becomes 2025 Make-or-Break Zone
XRP is trading at $1.37 and its trading higher than the support of $1.34 but facing a heavy resistance at $1.38.
The critical structural pivot zone of $1.80-2.00 is the critical 2025 structural pivot.
March structure has the targets of $2.78 and 3.60, with anticipated
CryptoNewsLand44m ago
XRP Slides to $1.42 After Losing $1.80–$2 Neckline as $1.39 Support Faces Immediate Test
XRP dropped to less than the $1.80-2 neckline and a key support area became an overhead and the overall trend was altered.
The current short-term trading corridor is between the support and resistance of the asset which is between $1.39 and $1.47 respectively.
A price above $1.39 will
CryptoNewsLand50m ago
Dogecoin Prints Monthly Morning Doji Star — Will $0.097 Break Next?
Dogecoin is forming a "Morning Doji Star" pattern on the monthly chart around $0.09, indicating a potential bullish reversal despite a recent 1.9% daily decline. Key support is at $0.09036 and resistance at $0.09707, with current trading at $0.09010.
CryptoNewsLand54m ago
Solana at $84: Two Liquidity Clusters Might Decide Next Move - U.Today
Solana's payments volume surges 755%, but its price drops 1.40% amid profit-taking and a stronger dollar. Market sentiment remains cautious, with two liquidity clusters forming at $95 and $78-$85, indicating potential future volatility.
UToday1h ago
PEPE Price Coils Within $0.053385–$0.053517 Band as Momentum Stays Balanced
PEPE is trading within a tight range, with support at $0.053385 and resistance at $0.053517. The token shows minimal daily gains and balanced momentum indicators, indicating potential for volatility. Despite limited movement against USDT, PEPE appreciates against BTC and ETH.
CryptoNewsLand1h ago