
Date: Sat, Dec 20 2025 | 05:55 PM GMT
The broader cryptocurrency market has continued to struggle with uneven and choppy price action over the past several weeks, a phase that began after the sharp sell-off on October 10. That correction pushed Ethereum (ETH) lower by nearly 26% over the last 60 days, keeping sustained pressure across the altcoin market. Worldcoin (WLD) has been no exception, remaining under heavy selling pressure during this period.
WLD is down more than 44% over the past two months. While the short-term trend still leans bearish, the higher-timeframe chart is starting to show a structure that often appears near potential market turning points. If key technical levels are reclaimed, the current setup could evolve into a broader recovery attempt.

Source: Coinmarketcap
Power of 3 Pattern in Focus
On the higher-timeframe chart, WLD appears to be forming a classic Power of 3 structure, a pattern frequently associated with market cycle lows and trend transitions. This structure typically unfolds in three stages—accumulation, manipulation, and expansion—with the most decisive move usually emerging once the final phase begins.
Earlier, WLD spent an extended period moving sideways within a well-defined range between $0.6528 and $0.5628. This low-volatility environment, highlighted by the grey box on the chart, reflects the accumulation phase. During such phases, price action tightens, volatility fades, and longer-term participants often begin positioning quietly while broader sentiment remains weak or indifferent.
That stability eventually gave way as broader market pressure intensified. WLD broke below the $0.5628 support and slid to a recent low near $0.4721 before attempting a modest rebound. This sharp downside move aligns closely with the manipulation phase of the Power of 3 pattern. Such breakdowns are often designed to trigger stop-losses and force capitulation, shaking out weaker holders before price looks for a base.
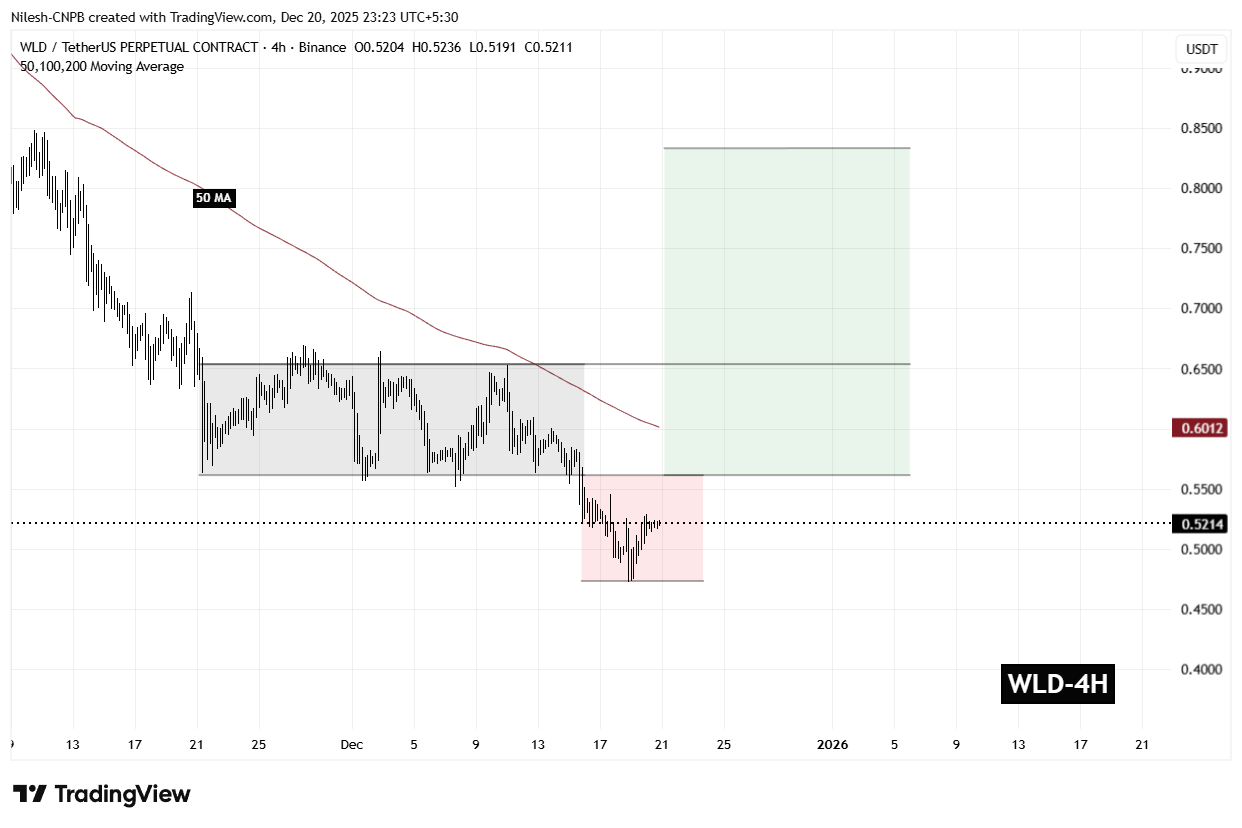
Worldcoin (WLD) 4H Chart/Coinsprobe (Source: Tradingview)
Notably, selling momentum has started to slow near this lower zone. Recent candles show reduced downside follow-through, suggesting that bearish pressure may be losing strength as price consolidates after the breakdown.
What’s Next for WLD?
At the time of writing, WLD continues to trade within the broader manipulation zone, which calls for caution. Price remains below the 50-period moving average near $0.6012, an area that now acts as an important short-term resistance. A sustained move back above this level would be an early signal that sellers are losing control.
For the bullish scenario to gain traction, WLD needs to reclaim both the $0.5628 level and establish acceptance above the $0.60–$0.65 resistance zone. A successful recovery into this former range would suggest that the manipulation phase has likely concluded and that the market may be transitioning toward the expansion phase of the structure.
If buyers manage to break and hold above $0.6528, the chart projection opens the door for a move toward the $0.83 region, which represents the measured expansion target and implies a potential upside of roughly 59% from current levels.
That said, this setup remains conditional. As long as WLD trades below $0.5628, downside risks cannot be ruled out, and the market remains vulnerable to further volatility. Holding recent lows and reclaiming key resistance levels will be critical for bulls looking to validate a bullish reversal narrative.
Disclaimer: The views and analysis presented in this article are for informational purposes only and reflect the author’s perspective, not financial advice. Technical patterns and indicators discussed are subject to market volatility and may or may not yield the anticipated results. Investors are advised to exercise caution, conduct independent research, and make decisions aligned with their individual risk tolerance.
Disclaimer: The information on this page may come from third parties and does not represent the views or opinions of Gate. The content displayed on this page is for reference only and does not constitute any financial, investment, or legal advice. Gate does not guarantee the accuracy or completeness of the information and shall not be liable for any losses arising from the use of this information. Virtual asset investments carry high risks and are subject to significant price volatility. You may lose all of your invested principal. Please fully understand the relevant risks and make prudent decisions based on your own financial situation and risk tolerance. For details, please refer to
Disclaimer.
Related Articles
SHIB Momentum Fades as Burn Rate Hits Zero and Bearish Trend Deepens
SHIB price weakens as momentum fades and the token trades within a narrow range.
Burn rate stalls for two days, removing a key narrative supporting short-term optimism.
Key support near $0.0000054 now determines whether recovery or deeper decline
CryptoNewsLand8m ago
Hidden "Death Spiral" Risk! Ethereum and Bitmine targeted by short-selling institutions
Ethereum is about to undergo a major upgrade, and the market is highly focused on it. However, short-selling firm Culper Research believes that the Ethereum economic model is failing and warns of a potential "death spiral." They point out that a significant drop in transaction fees and shrinking staking rewards will impact network security. The report also mentions Vitalik Buterin selling Ethereum and questions the market fundamentals, suggesting that Ethereum is facing a new reality.
区块客24m ago
Retail investors are not trading cryptocurrencies but stocks? Cryptocurrency market liquidity is moving to the US stock market, AI helps interpret financial reports and boosts confidence
Wintermute's research indicates that retail cryptocurrency funds are flowing heavily into the US stock market, reversing the correlation to become negatively correlated. As liquidity in the crypto market declines, retail investors prefer mature stock markets, aided by generative AI enhancing their investment capabilities. Cryptocurrencies are gradually becoming part of asset allocation.
CryptoCity2h ago
ETH drops 1.36% in 15 minutes: Deteriorating macro sentiment and liquidity crunch trigger spot selling pressure
From 02:45 to 03:00 on March 8, 2026 (UTC), ETH prices fluctuated sharply within the range of 1,936.0 to 1,969.18 USDT. The 15-minute candlestick yield was -1.36%, with an amplitude of 1.68%. The short-term downtrend intensified, market attention significantly increased, trading activity was high, and panic sentiment dominated.
The main driver of this anomaly was the widespread decline in global risk assets and escalating extreme panic sentiment. Major US stock indices experienced a sharp pullback, and the VIX fear index soared to 29.49 (+24.17%), leading to
GateNews3h ago
BTC drops 0.71% in 15 minutes: Weak macro data and miner sell-off resonate, increasing selling pressure
2026-03-08 02:45 to 03:00 (UTC), Bitcoin (BTC) price candlestick data shows a 15-minute return of -0.71%, with the lowest at 66,837.0 USDT and the highest at 67,402.7 USDT, with an amplitude of 0.84%. Short-term volatility has attracted market attention, with on-chain risk signals rising to 0.84, above the historical average, indicating cautious investor sentiment and increased market fluctuations.
The main driver of this anomaly is the US February employment data, which significantly underperformed expectations, with a sharp decrease in new jobs and the unemployment rate rising to 4.4%, combined with the US
GateNews3h ago