
Date: Mon, Dec 22, 2025 | 10:20 AM GMT
The broader altcoin market has remained stuck in choppy and uncertain price action over the past several weeks. The ongoing correction dragged Ethereum (ETH) lower by more than 22% over the last 60 days, reinforcing a short-term bearish tone across the altcoin space — and **Chainlink (LINK) **has not been spared.
LINK is down over 27% during the same period, reflecting persistent selling pressure and weak sentiment. However, beneath the surface, a combination of rising whale accumulation and a developing technical structure on the daily chart suggests that downside momentum may be slowing, potentially setting the stage for a rebound.
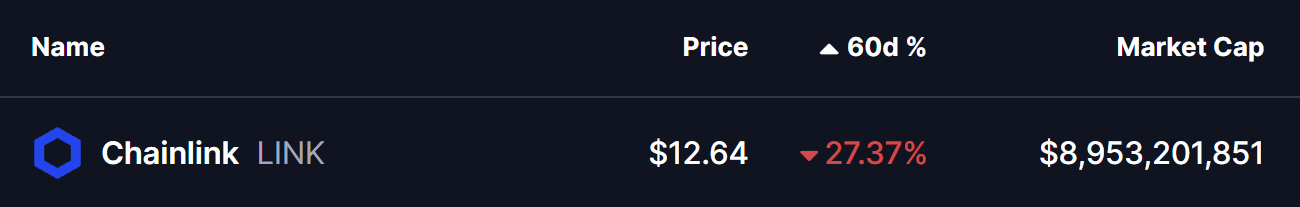
Source: Coinmarketcap
Whale Accumulation Surges Beneath the Sell-Off
Despite LINK’s recent underperformance, large holders appear to be positioning quietly. According to data shared by Lookonchain, over the past three days, 11 newly created wallets have withdrawn approximately 1.567 million LINK — worth nearly $19.8 million — from Binance.
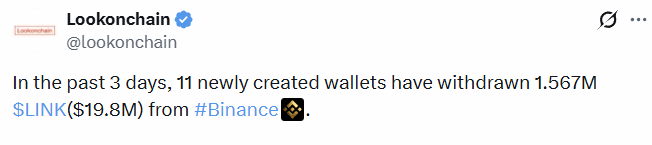
LINK Token Whale Accumulation/Source: @lookonchain (X)
This type of exchange outflow is typically associated with accumulation rather than distribution, as tokens moved off exchanges are less likely to be sold in the near term. While whale activity alone does not guarantee an upside move, it often appears during market phases where smart money begins building longer-term positions amid broader fear and uncertainty.
Harmonic Pattern Hints at Potential Upside
From a technical perspective, LINK’s daily chart is beginning to outline a Bearish Bat harmonic pattern. While the name may sound negative, this structure often produces a strong bullish move during the CD leg before reaching its final completion zone.
The pattern began near Point X around $19.04, followed by a sharp decline to Point A, which marked the initial capitulation move. LINK then rebounded toward Point B, before undergoing a deeper corrective pullback into Point C near $11.73, where buyers stepped in decisively.
Since forming this higher-quality low, LINK has stabilized and rebounded toward the $12.66 region, signaling the early development of the CD leg. This phase is typically where momentum starts to accelerate if the pattern remains valid.
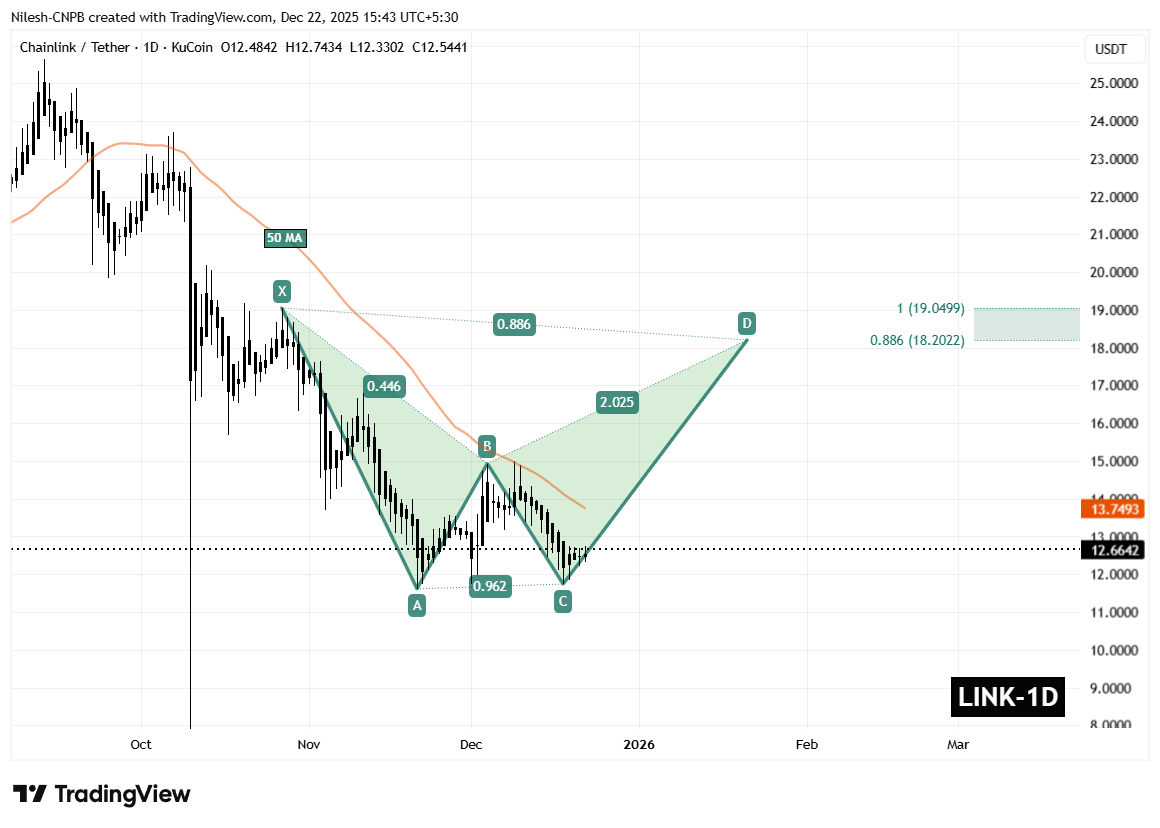
Chainlink (LINK) Daily Chart/Coinsprobe (Source: Tradingview)
Price is now trading just below the 50-day moving average, currently positioned near $13.74. This level is acting as short-term dynamic resistance, and the chart shows price compressing beneath it. A daily close above the 50 MA would be an important technical confirmation, signaling that buyers are regaining control and that the harmonic expansion is gaining traction.
What’s Next for LINK?
If bulls manage to reclaim and hold above the 50-day MA, the harmonic structure projects a potential upside move toward the Potential Reversal Zone (PRZ) between $18.20 and $19.04. This area aligns closely with the 0.886 and 1.0 Fibonacci extensions, which often act as completion zones for Bearish Bat patterns. Reaching this zone would represent a meaningful recovery from current levels and a clear shift in short-term momentum.
That said, the bullish setup remains conditional. A failure to hold the C-level support near $11.73 would invalidate the harmonic structure and could reopen the door to further consolidation or renewed downside pressure before any sustainable recovery takes place.
For now, LINK sits at an important technical crossroads. With whale accumulation increasing and price stabilizing above a well-defined support base, the coming sessions may prove critical in determining whether this setup evolves into a broader upside move or remains a temporary relief rally.
Disclaimer: The views and analysis presented in this article are for informational purposes only and reflect the author’s perspective, not financial advice. Technical patterns and indicators discussed are subject to market volatility and may or may not yield the anticipated results. Investors are advised to exercise caution, conduct independent research, and make decisions aligned with their individual risk tolerance.
Disclaimer: The information on this page may come from third parties and does not represent the views or opinions of Gate. The content displayed on this page is for reference only and does not constitute any financial, investment, or legal advice. Gate does not guarantee the accuracy or completeness of the information and shall not be liable for any losses arising from the use of this information. Virtual asset investments carry high risks and are subject to significant price volatility. You may lose all of your invested principal. Please fully understand the relevant risks and make prudent decisions based on your own financial situation and risk tolerance. For details, please refer to
Disclaimer.
Related Articles
PEPE Hovers at Critical $0.053414 Support as $432M Volume Surge Tightens Breakout Watch
PEPE is trading at $0.053416, just above support at $0.053414, with significant trading volume up 22.14%. Resistance is at $0.053676. Despite a slight decrease in price, there’s increased market activity, suggesting potential volatility.
CryptoNewsLand23m ago
DXY Retest at 99.183: Will 100–101 Break as US Degen Index Stabilizes?
DXY trades at 99.183 while retesting the 100–101 monthly resistance zone.
US Degen Index 6900 sits at $0.0001197 with support at $0.0001175 and resistance at $0.0001214.
A break above 101 on DXY would shift structure higher, while rejection keeps price below key resistance.
The U.
CryptoNewsLand27m ago
AVAX Tests $9.38 Resistance After 8.3% Surge — Breakout or Pullback Ahead?
AVAX is also trading at $9.16 with a daily gain of 8.3 per cent, but still below $9.38 resistance.
Strong buyer activity near $8.46 continues to prevent deeper downside extensions.
A daily close above $9.38 could open room toward $9.50, while rejection risks $8.30.
Avalanche’s
CryptoNewsLand1h ago
XRP Holds $1.34 Support as $1.80–$2.00 Becomes 2025 Make-or-Break Zone
XRP is trading at $1.37 and its trading higher than the support of $1.34 but facing a heavy resistance at $1.38.
The critical structural pivot zone of $1.80-2.00 is the critical 2025 structural pivot.
March structure has the targets of $2.78 and 3.60, with anticipated
CryptoNewsLand1h ago
Dogecoin Prints Monthly Morning Doji Star — Will $0.097 Break Next?
Dogecoin is forming a "Morning Doji Star" pattern on the monthly chart around $0.09, indicating a potential bullish reversal despite a recent 1.9% daily decline. Key support is at $0.09036 and resistance at $0.09707, with current trading at $0.09010.
CryptoNewsLand1h ago
SHIB Faces Critical Breakout Test as Forecast Points to Short-Term 7.47% Gain
Shiba Inu (SHIB) is trading close to the support level of $0.05545, showing a recent decline but also potential for a 7.47% upside by March 2026. The price remains within established boundaries, facing key resistance at $0.055727. Future movements depend on breaking above resistance or falling below support.
CryptoNewsLand2h ago