
Date: Mon, Dec 29, 2025 | 11:04 AM GMT
The broader cryptocurrency market has seen a short-term retracement over the past few hours, with Bitcoin (BTC) slipping below the $90K mark and trading closer to $88K. This pullback has placed temporary pressure on several altcoins, including Near Protocol (NEAR), which is also trading lower on the day.
NEAR is down around 3% intraday, but beneath the surface, its price structure is beginning to reflect a meaningful shift. Rather than signaling weakness, the ongoing consolidation appears to be shaping a potential bullish continuation setup.

Source: Coinmarketcap
Rounding Bottom in Play
On the 4-hour timeframe, Near Protocol is forming a textbook rounding bottom — a classic bullish reversal pattern that typically develops after a prolonged period of selling pressure. This structure highlights a gradual transition from distribution to accumulation, as sellers lose control and buyers quietly step back in.
Earlier, NEAR faced strong rejection near the $1.7576 neckline zone before entering a sharp decline. The sell-off eventually found a base near $1.4062, a level that repeatedly acted as a demand zone. Each attempt to push price lower was absorbed by buyers, preventing a deeper breakdown and establishing a solid foundation for reversal.
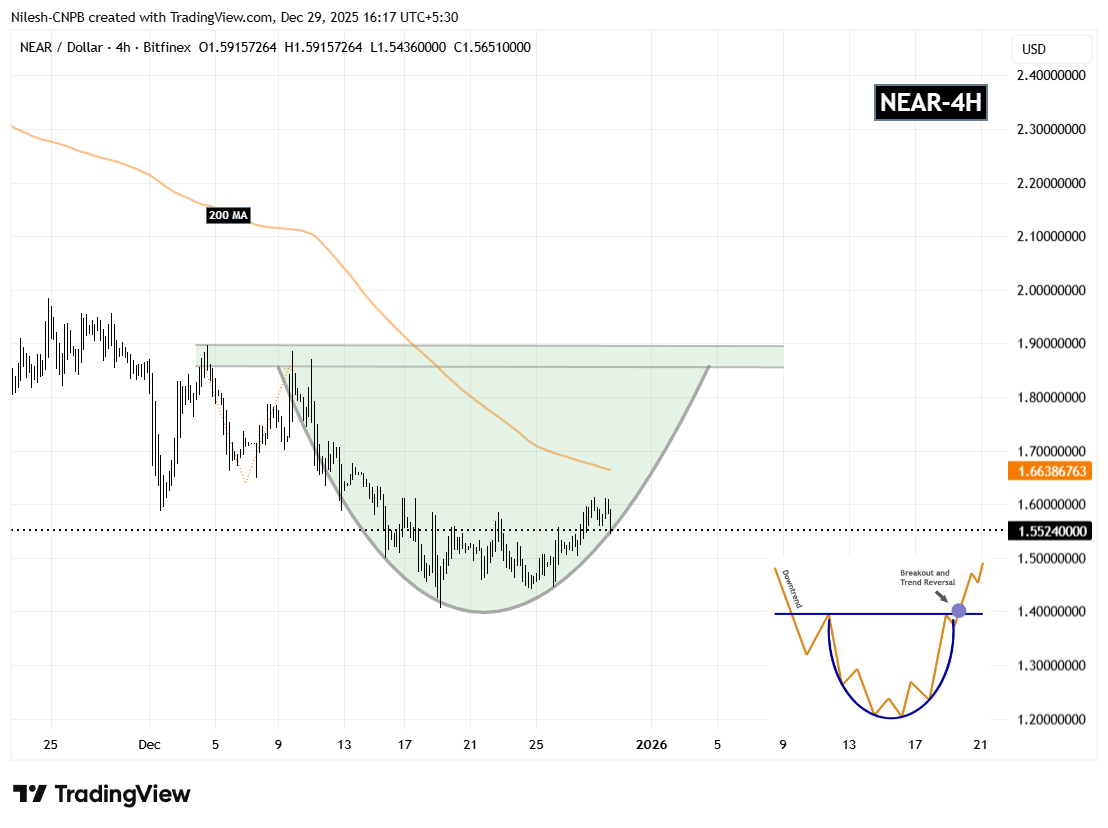
Near Protocol (NEAR) 4H Chart/Coinsprobe (Source: Tradingview)
Since forming this base, NEAR’s price action has begun to curve higher in a smooth, rounded fashion. The steady recovery toward the $1.5524 region suggests selling pressure is fading, while accumulation is gradually strengthening. This type of structure often precedes a more decisive trend shift once key resistance levels are reclaimed.
What’s Next for NEAR?
For the rounding bottom pattern to fully activate, NEAR needs to reclaim the 200-hour moving average, currently hovering around $1.5524. A decisive break and sustained hold above this level would confirm a momentum shift and signal that buyers are regaining control after an extended corrective phase.
Beyond the moving average, the most critical technical hurdle remains the neckline resistance near $1.7576. A clean breakout above this zone would validate the broader reversal structure and could trigger a stronger bullish expansion, as sidelined traders and momentum participants begin to re-enter.
Until those levels are reclaimed, the pattern remains in development. Short-term pullbacks or sideways consolidation are still possible if NEAR struggles near the 200-hour MA. However, as long as price continues to hold within the rounded base, the broader bottoming structure remains intact.
Overall, NEAR is approaching an important technical inflection point. The emerging rounding bottom, improving structure, and proximity to major resistance levels suggest the coming sessions could play a decisive role in determining the token’s next directional move.
Disclaimer
The views and analysis presented in this article are for informational purposes only and reflect the author’s perspective, not financial advice. Technical patterns and indicators discussed are subject to market volatility and may or may not yield the anticipated results. Investors are advised to exercise caution, conduct independent research, and make decisions aligned with their individual risk tolerance.
About Author
Nilesh Hembade is the Founder and Lead Author of Coinsprobe, with over 5 years of experience in the cryptocurrency and blockchain industry. Since launching Coinsprobe in 2023, he has been providing daily, research-driven insights through in-depth market analysis, on-chain data, and technical research.

Disclaimer: The information on this page may come from third parties and does not represent the views or opinions of Gate. The content displayed on this page is for reference only and does not constitute any financial, investment, or legal advice. Gate does not guarantee the accuracy or completeness of the information and shall not be liable for any losses arising from the use of this information. Virtual asset investments carry high risks and are subject to significant price volatility. You may lose all of your invested principal. Please fully understand the relevant risks and make prudent decisions based on your own financial situation and risk tolerance. For details, please refer to
Disclaimer.
Related Articles
BTC surged to $74,000 before falling back below $69,000, with the total market capitalization evaporating approximately $110 billion.
This week, the cryptocurrency industry received positive news from Wall Street, but Bitcoin's price fell from $74,000 to $69,000, with a market cap evaporating approximately $110 billion. The strength of the US dollar and macroeconomic factors are putting pressure on risk assets. Short-term holders are taking profits, increasing selling pressure, but the US spot Bitcoin ETF recorded net inflows, indicating an improvement in the funding environment.
GateNews2h ago
Today, the cryptocurrency Fear & Greed Index dropped to 12, indicating the market is in extreme fear.
Gate News Report, March 7th, according to Alternative.me data, today the cryptocurrency fear and greed index dropped to 12, indicating the market is in a state of "extreme fear." Yesterday, the index was 18, also in the "extreme fear" zone.
GateNews2h ago
Kaspa Tops CoinMarketCap Community Sentiment With 90% Bullish Votes – Here’s Why
Kaspa’s price hasn’t had the best year. The coin is currently trading around $0.03, and on the yearly chart it’s still down roughly 60%. That kind of drop usually hurts sentiment in most crypto
CaptainAltcoin3h ago
Will XRP Hold $1.33 or Extend Toward $1.30 Before Rebound?
XRP is currently trading at $1.35, experiencing a 1.3% decline. Key support is at $1.34, while resistance is at $1.40. The price is testing around the Fibonacci levels of $1.33 and $1.30, crucial for potential upward movement or deeper decline.
CryptoNewsLand7h ago
Dogecoin Monthly Breakdown Pattern Reappears as Price Tests $0.0918
Dogecoin is currently trading at $0.09205 at a gain of 2.3, with support of above $0.08878.
As can be seen in the monthly chart, there are recurring breakdown areas that have been followed by significant expansions in price.
The short-term trading range is narrow and the immediate point o
CryptoNewsLand7h ago