
Date: Fri, Dec 26, 2025 | 10:28 AM GMT
The broader cryptocurrency market is showing modest strength, with both Bitcoin (BTC) and Ethereum (ETH) trading in the green. This steady performance from the majors has helped stabilize overall market sentiment, allowing several altcoins to begin forming constructive technical structures including Virtuals Protocol (VIRTUAL).
VIRTUAL is currently trading slightly higher on the day, but the real story lies beneath the surface. The daily chart structure is beginning to hint at a potential shift in momentum, suggesting that sellers may be losing control as buyers quietly step back in.
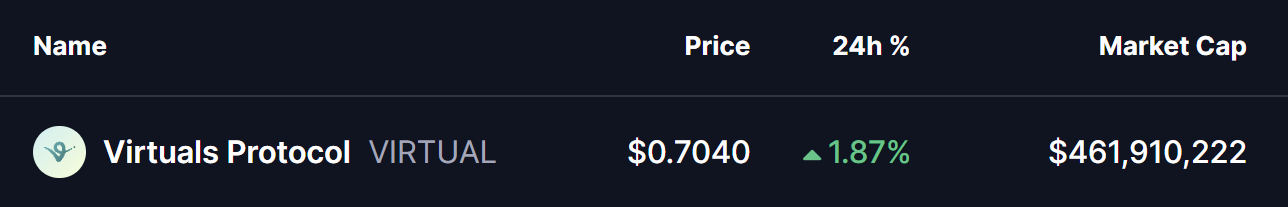
Source: Coinmarketcap
Falling Wedge Pattern Signals a Possible Reversal
On the daily timeframe, VIRTUAL is trading within a clearly defined falling wedge pattern. This structure is widely recognized as a bullish reversal formation, typically developing when selling pressure gradually weakens while price continues to make lower highs and lower lows within converging trendlines.
After several weeks of persistent downside, VIRTUAL found support around the $0.6518 level. This bounce marked an important reaction low and helped price recover toward the $0.7040 area. As seen on the chart, price is now pressing close to the wedge’s upper boundary, indicating that buyers are starting to challenge the prevailing downtrend.
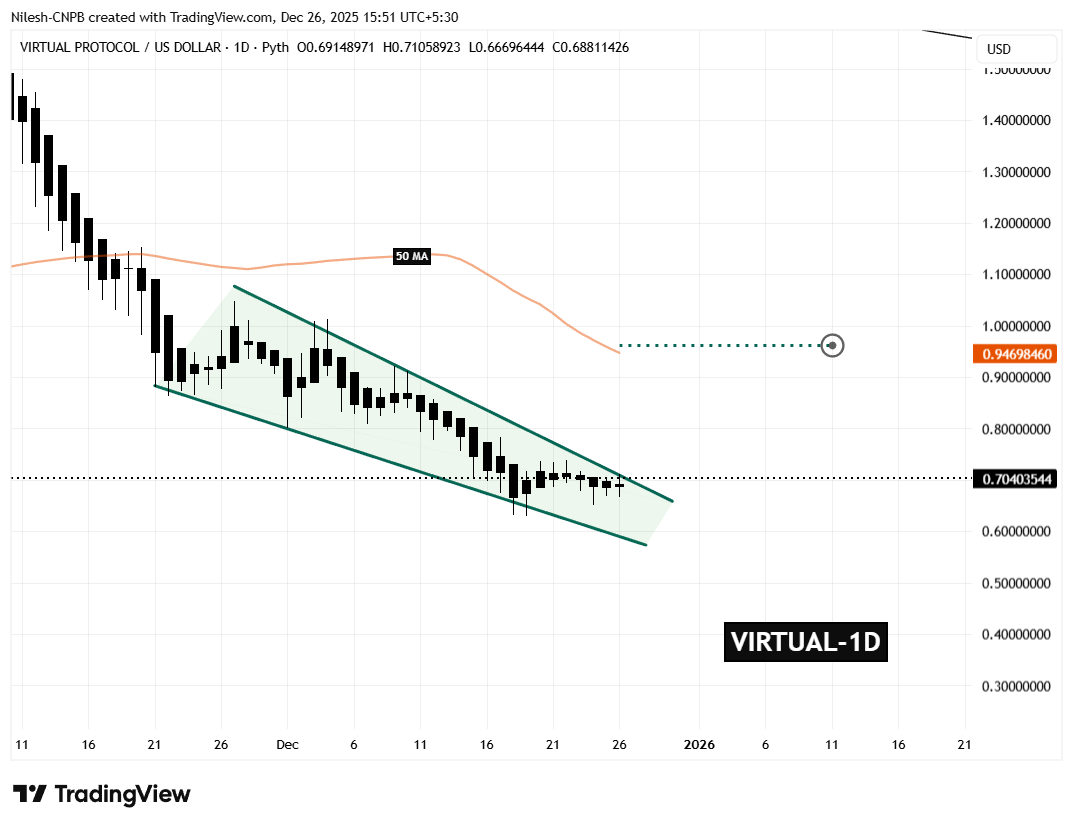
VIRTUAL Daily Chart/Coinsprobe (Source: Tradingview)
The compression within the wedge suggests that a decisive move may be approaching, with volatility likely to expand once price breaks out of the structure.
What’s Next for VIRTUAL?
A confirmed breakout above the falling wedge resistance, followed by a successful retest, would significantly improve the bullish outlook for VIRTUAL. In such a scenario, the first major area of interest lies near the 50-day moving average, currently positioned around $0.9469. This level also aligns closely with prior price congestion, increasing its technical importance.
Beyond that, the projected measured move from the wedge points toward a potential upside target near $0.962. Reaching this zone would represent a gain of more than 37% from current price levels, making it a notable recovery move if momentum accelerates.
On the flip side, failure to break above the wedge resistance could keep VIRTUAL range-bound. In that case, price may revisit the lower boundary of the wedge, where buyers would need to defend support to prevent a deeper retracement.
Disclaimer: The views and analysis presented in this article are for informational purposes only and reflect the author’s perspective, not financial advice. Technical patterns and indicators discussed are subject to market volatility and may or may not yield the anticipated results. Investors are advised to exercise caution, conduct independent research, and make decisions aligned with their individual risk tolerance.
Disclaimer: The information on this page may come from third parties and does not represent the views or opinions of Gate. The content displayed on this page is for reference only and does not constitute any financial, investment, or legal advice. Gate does not guarantee the accuracy or completeness of the information and shall not be liable for any losses arising from the use of this information. Virtual asset investments carry high risks and are subject to significant price volatility. You may lose all of your invested principal. Please fully understand the relevant risks and make prudent decisions based on your own financial situation and risk tolerance. For details, please refer to
Disclaimer.
Related Articles
Polkadot to Reset Tokenomics on March 12 With Major DOT Supply and Staking Changes
Polkadot will introduce a new monetary framework on March 12 that sets DOT’s supply cap at 2.1 billion and lowers emissions by 53.6%.
The overhaul will also create a Dynamic Allocation Pool and shorten the DOT unbonding period from 28 days to 24–48 hours.
On March 12, Polkadot will reset
CryptoNewsFlash1h ago
Bitcoin May Be Closer to a Bottom Than Most Think, Chart Signals
The Bitcoin price slipped about 2% today, trading slightly below $68,000 after pushing above $73,000 earlier this week, as already covered on our site. The move added fresh pressure to a market that still feels shaky, especially after several failed attempts to hold higher levels.
Still, not e
CaptainAltcoin1h ago
Dogecoin Monthly Breakdown Pattern Reappears as Price Tests $0.0918
Dogecoin is currently trading at $0.09205 at a gain of 2.3, with support of above $0.08878.
As can be seen in the monthly chart, there are recurring breakdown areas that have been followed by significant expansions in price.
The short-term trading range is narrow and the immediate point o
CryptoNewsLand1h ago
Solana Eyes $90.6 Trigger Point as $83 Support Holds and Liquidation Pressure Builds
A large cluster of short positions faces liquidation if SOL reaches $90.6, potentially increasing volatility.
SOL trades between $83.00 support and $89.58 resistance, keeping price action compressed in the short term.
SOL posts a 0.8% daily gain and rises 0.7% against BTC, holding
CryptoNewsLand1h ago
Crypto Market Plunges As Extreme Fear Controls Investor Sentiment
The global crypto market is notably bearish, with a 2.93% drop in market capitalization to $2.32T. Bitcoin and Ethereum saw decreases of 3.07% and 4.01%, respectively. Meanwhile, notable gainers include $XBTC, $TRUMP, and $PEPE. DeFi TVL and NFT sales also declined significantly, while key investments from YZi Labs and Kazakhstan's central bank emerged.
BlockChainReporter2h ago
HBAR at a Crossroads: Will $0.095 Support Trigger a Break Toward $0.106?
HBAR is trading at $0.09739 and above the S/R flip of $0.094-$0.096 in the 12H chart.
The nearest resistance will be at $0.10 with a falling trendline pressure at around $0.104-$0.106.
The support is at $0.095835 and a breakdown at the
CryptoNewsLand2h ago