
Date: Mon, Dec 29, 2025 | 04:10 PM GMT
The broader cryptocurrency market has seen a short-term pullback over the past few hours, with Bitcoin (BTC) slipping below the $87K level after briefly trading above $90K. This retracement has spilled over into major altcoins, including Avalanche (AVAX), which is also experiencing mild selling pressure.
AVAX is trading slightly in the red today, but beneath the surface, its price structure is beginning to tell a more constructive story. The 4-hour chart reveals a high-probability bullish setup that could hint at a stronger upside move once momentum fully shifts back in favor of buyers.
Source: Coinmarketcap
Power of 3 Pattern Takes Shape
On the 4-hour timeframe, AVAX appears to be forming a classic Power of 3 (PO3) pattern — a structure commonly linked to smart money accumulation and trend continuation. This pattern typically unfolds in three distinct phases: accumulation, manipulation, and expansion, often preceding a sharp directional move.
Accumulation Phase
During the accumulation phase, AVAX spent an extended period trading sideways within a defined range, capped by resistance near $14.80 and supported around $12.64. This tight consolidation reflected balance between buyers and sellers, allowing larger participants to quietly build positions while volatility remained compressed.
The prolonged range-bound action signaled that selling pressure was gradually being absorbed, even as the broader trend remained weak.
Manipulation Flush
The manipulation phase played out when AVAX briefly broke below the $12.64 support, triggering a sharp downside move toward the $11.31 area. This sudden drop resembles a classic liquidity sweep, where stop-loss orders and late sellers are flushed out before a reversal takes place.
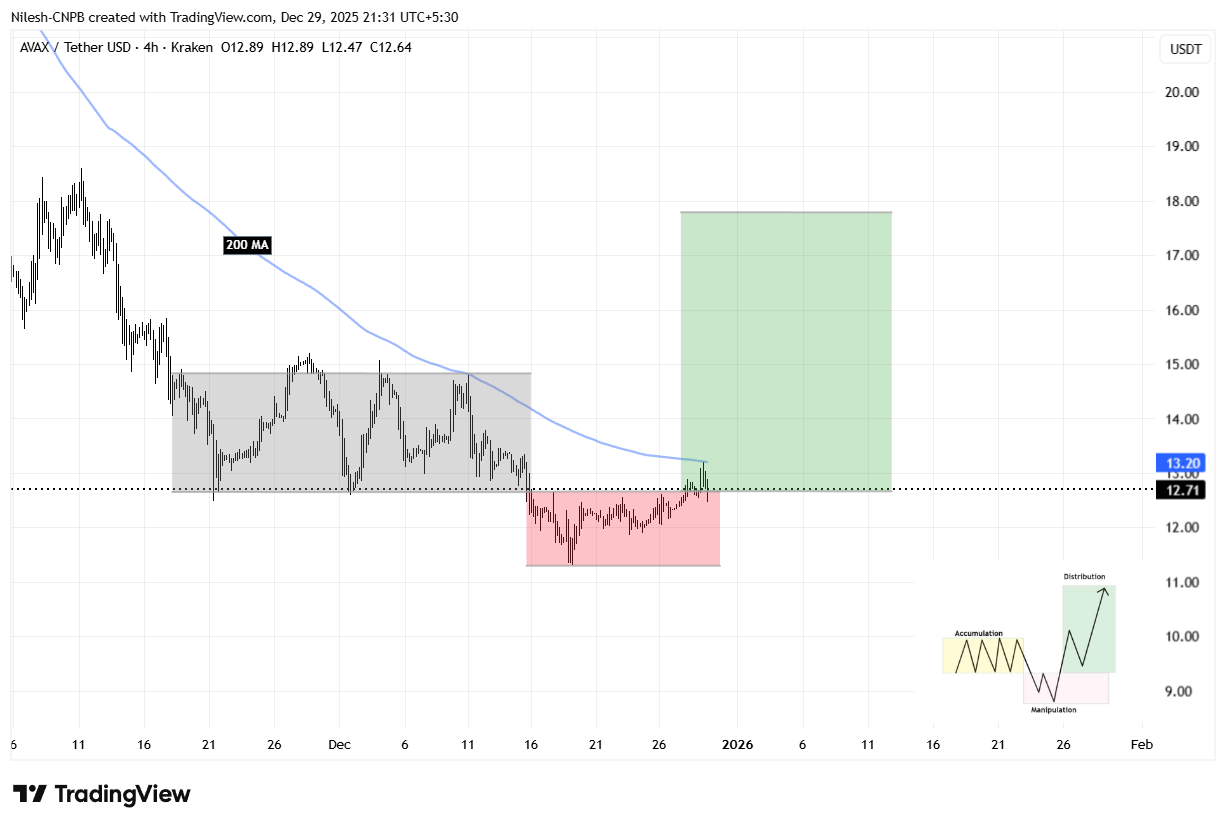
Avalanche (AVAX) 4H Chart/Coinsprobe (Source: Tradingview)
Expansion Phase Begins to Unfold
Following the sweep of lows, AVAX rebounded quickly and reclaimed the $12.64 level, signaling that buyers have stepped back in with conviction. This recovery suggests the early stages of the expansion phase may now be underway.
Price is currently pushing toward the 200-hour moving average near $13.20, a level that has consistently acted as dynamic resistance during the broader downtrend. A sustained move above this moving average would represent a meaningful shift in short-term momentum and strengthen the bullish reversal narrative.
What’s Next for AVAX?
If AVAX manages to break and hold above the 200-hour moving average, the next major resistance lies at $14.80 — the upper boundary of the prior accumulation range. A decisive reclaim of this zone would confirm a bullish breakout and likely attract fresh momentum participation.
Based on the Power of 3 structure, a successful breakout could open the door for a measured move toward the $18.29 region, derived from projecting the height of the accumulation range upward from the breakout point. This target aligns closely with the expansion zone highlighted on the chart.
That said, caution remains necessary. A failure to hold above $12.64 would weaken the expansion thesis and could force AVAX back into consolidation, delaying any meaningful upside continuation.
For now, AVAX sits at a technically critical inflection point. The structure suggests that smart money positioning may already be in progress, with the coming sessions likely to determine whether the expansion phase fully materializes.
Disclaimer
The views and analysis presented in this article are for informational purposes only and reflect the author’s perspective, not financial advice. Technical patterns and indicators discussed are subject to market volatility and may or may not yield the anticipated results. Investors are advised to exercise caution, conduct independent research, and make decisions aligned with their individual risk tolerance.
About Author
Nilesh Hembade is the Founder and Lead Author of Coinsprobe, with over 5 years of experience in the cryptocurrency and blockchain industry. Since launching Coinsprobe in 2023, he has been providing daily, research-driven insights through in-depth market analysis, on-chain data, and technical research.

Disclaimer: The information on this page may come from third parties and does not represent the views or opinions of Gate. The content displayed on this page is for reference only and does not constitute any financial, investment, or legal advice. Gate does not guarantee the accuracy or completeness of the information and shall not be liable for any losses arising from the use of this information. Virtual asset investments carry high risks and are subject to significant price volatility. You may lose all of your invested principal. Please fully understand the relevant risks and make prudent decisions based on your own financial situation and risk tolerance. For details, please refer to
Disclaimer.
Related Articles
ETH drops 1.36% in 15 minutes: Deteriorating macro sentiment and liquidity crunch trigger spot selling pressure
From 02:45 to 03:00 on March 8, 2026 (UTC), ETH prices fluctuated sharply within the range of 1,936.0 to 1,969.18 USDT. The 15-minute candlestick yield was -1.36%, with an amplitude of 1.68%. The short-term downtrend intensified, market attention significantly increased, trading activity was high, and panic sentiment dominated.
The main driver of this anomaly was the widespread decline in global risk assets and escalating extreme panic sentiment. Major US stock indices experienced a sharp pullback, and the VIX fear index soared to 29.49 (+24.17%), leading to
GateNews1h ago
BTC drops 0.71% in 15 minutes: Weak macro data and miner sell-off resonate, increasing selling pressure
2026-03-08 02:45 to 03:00 (UTC), Bitcoin (BTC) price candlestick data shows a 15-minute return of -0.71%, with the lowest at 66,837.0 USDT and the highest at 67,402.7 USDT, with an amplitude of 0.84%. Short-term volatility has attracted market attention, with on-chain risk signals rising to 0.84, above the historical average, indicating cautious investor sentiment and increased market fluctuations.
The main driver of this anomaly is the US February employment data, which significantly underperformed expectations, with a sharp decrease in new jobs and the unemployment rate rising to 4.4%, combined with the US
GateNews1h ago
The US-Iran conflict enters the second phase: Trump emphasizes "no ground action for now," airstrikes have destroyed over 3,000 targets, Bitcoin drops to 67,000.
Trump stated that the U.S. military currently has no plans to deploy ground troops, mainly conducting airstrikes, and has destroyed over 3,000 Iranian military targets. Market risk aversion has increased, with Bitcoin dropping to $67,000. The fighting continues between both sides, and Iran has vowed to retaliate.
動區BlockTempo2h ago
PEPE faces volatility risk as the threat of a "short squeeze" increases
The memecoin market is experiencing a significant downturn as the total industry capitalization has dropped by 48% over the past year and declined another 6.9% in the most recent month, according to data from CoinMarketCap. Meanwhile, a report from Glassnode indicates that this sector has only grown modestly by 2.2% in the past t
TapChiBitcoin2h ago
Willy Woo: BTC's early decline was too rapid, and it is now creating conditions for a rebound to $85,000.
On March 8th, analyst Willy Woo pointed out that Bitcoin faced resistance near $75,000, but since mid-February, capital flows have been recovering, and market sentiment may shift toward risk appetite. Although there is a short-term rebound opportunity, in the long term, Bitcoin remains in the mid-stage of a bear market and may experience sideways consolidation and test resistance levels.
GateNews2h ago