
Date: Sat, Dec 27, 2025 | 06:45 AM GMT
Hyperliquid (HYPE), the native token of the fast-growing decentralized exchange, has been under pressure over the past month, sliding nearly 27% amid broader weakness across the altcoin market. However, recent price action suggests that bearish momentum may be easing. HYPE has turned green today with modest gains, but more importantly, its technical structure is flashing early signs of a potential bullish continuation.
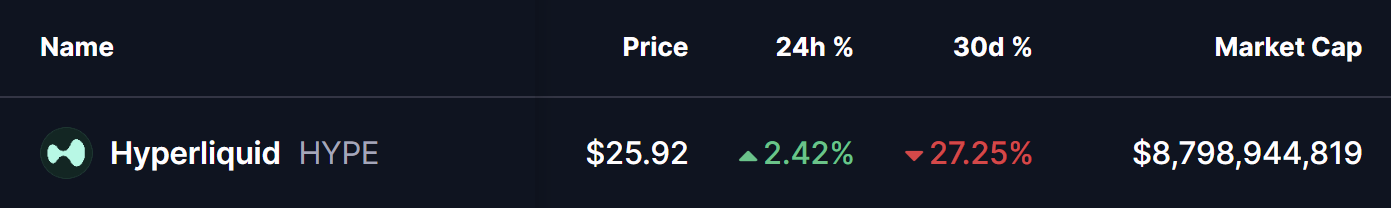
Source: Coinmarketcap
After weeks of consolidation, the token appears to be transitioning from a corrective phase into a possible expansion move, supported by improving market sentiment and a clear breakout on lower timeframes.
Ascending Triangle Breakout
On the 4-hour chart, HYPE had been trading within a well-defined ascending triangle pattern — a bullish structure characterized by higher lows pressing against a flat resistance level. Throughout this consolidation phase, sellers repeatedly defended the $25.66 region, while buyers continued to step in at progressively higher prices, tightening the price range.
That standoff has now resolved to the upside. Bulls successfully pushed HYPE above the $25.66 resistance, triggering a confirmed breakout and driving price toward a local high near $26.43. This move marks a clear shift in short-term momentum and suggests growing confidence among buyers after an extended period of uncertainty.
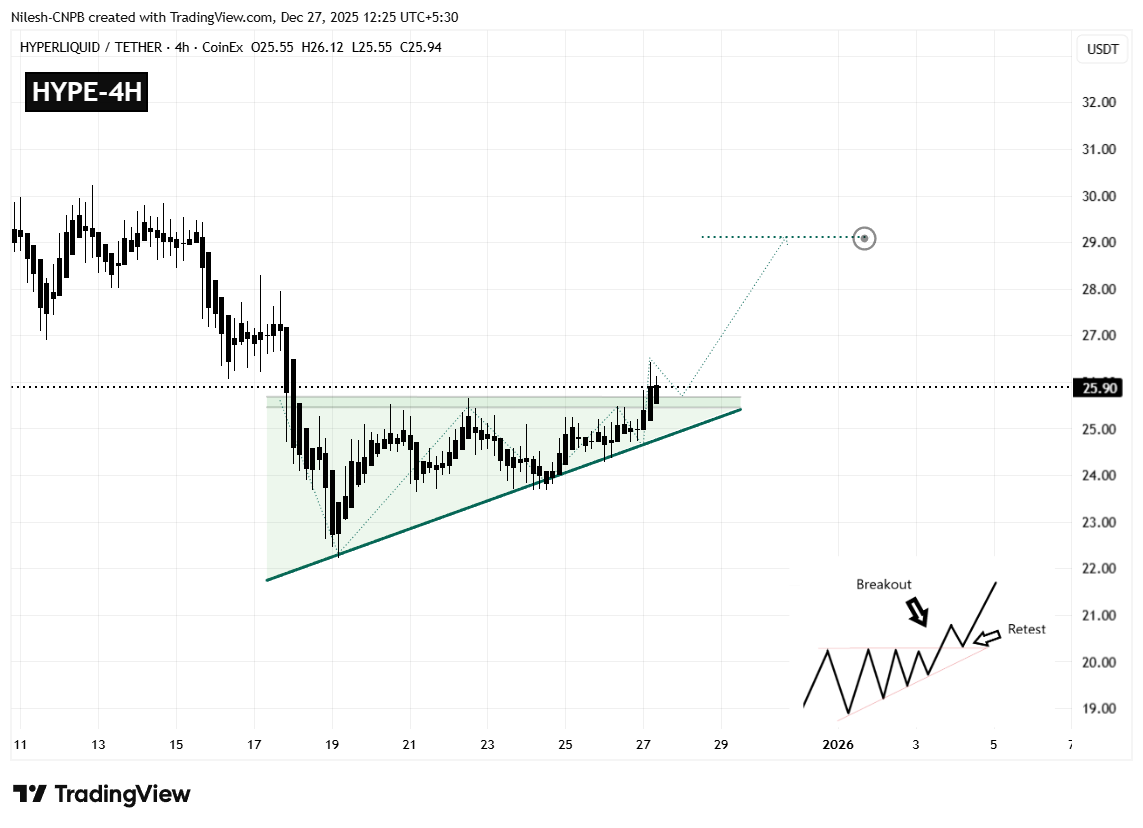
Hyperliquid (HYPE) 4H Chart/Coinsprobe (Source: Tradingview)
The breakout also aligns with the rising trendline support that has guided price higher since the recent swing low, further strengthening the bullish case.
What’s Next for HYPE?
Following a breakout of this nature, a brief pause or pullback is often healthy. In HYPE’s case, the $25.48–$25.66 zone now becomes a key area to watch. A controlled retest of this region — followed by a strong reaction higher — would confirm the former resistance as new support and reinforce the bullish structure.
If that scenario plays out, the chart points toward a potential upside move toward the $29.10 region. This target represents roughly a 12% upside from current levels and aligns with the projected measured move of the ascending triangle.
On the downside, failure to hold above the breakout zone could weaken the bullish outlook. A drop back below the former resistance or a loss of trendline support may expose HYPE to renewed selling pressure, potentially leading to a deeper consolidation before any fresh attempt higher.
For now, the breakout remains intact, and as long as buyers defend the newly reclaimed levels, HYPE appears positioned for a continued recovery move in the sessions ahead.
Disclaimer: The views and analysis presented in this article are for informational purposes only and reflect the author’s perspective, not financial advice. Technical patterns and indicators discussed are subject to market volatility and may or may not yield the anticipated results. Investors are advised to exercise caution, conduct independent research, and make decisions aligned with their individual risk tolerance.
Disclaimer: The information on this page may come from third parties and does not represent the views or opinions of Gate. The content displayed on this page is for reference only and does not constitute any financial, investment, or legal advice. Gate does not guarantee the accuracy or completeness of the information and shall not be liable for any losses arising from the use of this information. Virtual asset investments carry high risks and are subject to significant price volatility. You may lose all of your invested principal. Please fully understand the relevant risks and make prudent decisions based on your own financial situation and risk tolerance. For details, please refer to
Disclaimer.
Related Articles
XRP Slides to $1.42 After Losing $1.80–$2 Neckline as $1.39 Support Faces Immediate Test
XRP dropped to less than the $1.80-2 neckline and a key support area became an overhead and the overall trend was altered.
The current short-term trading corridor is between the support and resistance of the asset which is between $1.39 and $1.47 respectively.
A price above $1.39 will
CryptoNewsLandJust Now
Polkadot Holds $1.46 Support as Descending Channel Caps Upside Near $1.53
The heaviest resistance is at the 4-hour chart where DOT trades within a downward channel and resistance levels are formed near the levels of $1.50-$1.53.
The nearest support is at $1.46 and a more profound zone of demand is at the range of $1.38 to $1.40.
Even with a 1.5 price drop, DOT
CryptoNewsLand10m ago
WHITE Holds Firm At $0.00008064 As Its Consolidative Movement Suggests Upcoming 60% Spike Amid Wh...
The WhiteRock (WHITE) coin is attracting market attention with its price momentum, according to a revelation disclosed today by market analyst AltsDaddy. As pointed out by the analyst, WHITE’s price reclaimed the $0.03963149 level while its trading volume surpassed the $3,406,503 mark, signaling
BlockChainReporter57m ago
PEPE Stalls at $0.053354 While Oscillators Drift Below 40 Inside Tight Trading Band
PEPE fell to 2.4 per cent to trade at a price of $0.053354 but above the level of support in the vicinity of $0.053325.
Momentum indicators are tight and oscillator values are close to 39.47 and 36.73 and MACD is close to zero line.
The intra-day range of $0.053325 to $0.053473 is still r
CryptoNewsLand1h ago
No, Bitcoin Is Not Forming 'Cup and Handle' Pattern to $500,000, Says Peter Brandt - U.Today
Peter Brandt, a veteran market analyst, strongly criticizes the prediction of Bitcoin reaching $500,000, arguing it misinterprets the "cup and handle" pattern. He emphasizes the necessity of proper technical analysis and warns against unwarranted optimism based on flawed interpretations.
UToday1h ago
Shiba Inu 658% Jump in Spot Flows as Activity Picks up for SHIB - U.Today
Shiba Inu experienced a 658% surge in spot flows recently, reflecting increased market demand amid a crypto recovery. The current price is $0.000005437, with significant resistance at $0.00000587. Petitions for economic data this week could influence market movements.
UToday1h ago