
Date: Wed, Dec 31, 2025 | 11:36 AM GMT
As the final day of 2025 arrives, the broader cryptocurrency market is showing modest strength. Both Bitcoin (BTC) and Ethereum (ETH) are trading slightly in the green, helping stabilize overall sentiment. This steady backdrop has created room for select altcoins — including Pump.fun (PUMP) — to begin forming constructive technical structures after prolonged downside pressure.
PUMP is starting to stand out, posting a nearly 5% daily gain and trimming its 60-day decline to around 57%. While the recovery is still early, the more important development is visible on the daily chart, where price action is beginning to hint at a meaningful structural shift. If confirmed, this setup could mark the early stages of a broader bullish continuation.
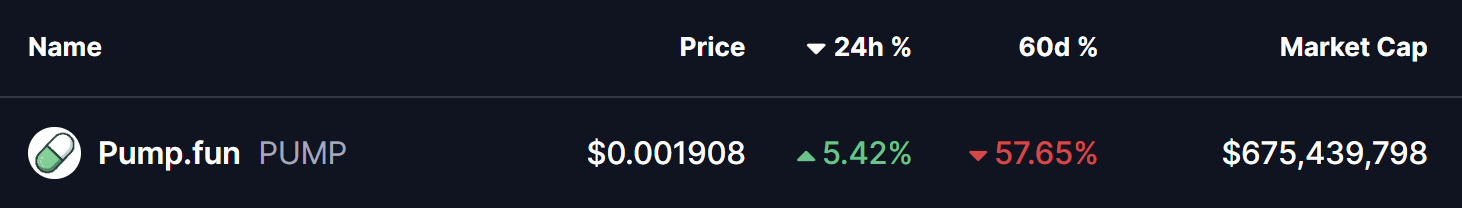
Source: Coinmarketcap
Rounding Bottom in Play
On the daily timeframe, PUMP appears to be carving out a classic rounding bottom formation — a well-known bullish reversal pattern that typically develops after an extended downtrend. This pattern reflects a slow but steady transition from aggressive selling to quiet accumulation, as sellers gradually lose control and buyers begin stepping in with more confidence.
Earlier in the trend, PUMP faced strong rejection near the $0.03396 neckline region, which triggered a sharp and extended decline. That sell-off eventually found a floor near the $0.0017 level, a zone that has since acted as a critical demand area. Multiple defenses of this region prevented further downside and laid the foundation for a potential trend reversal.
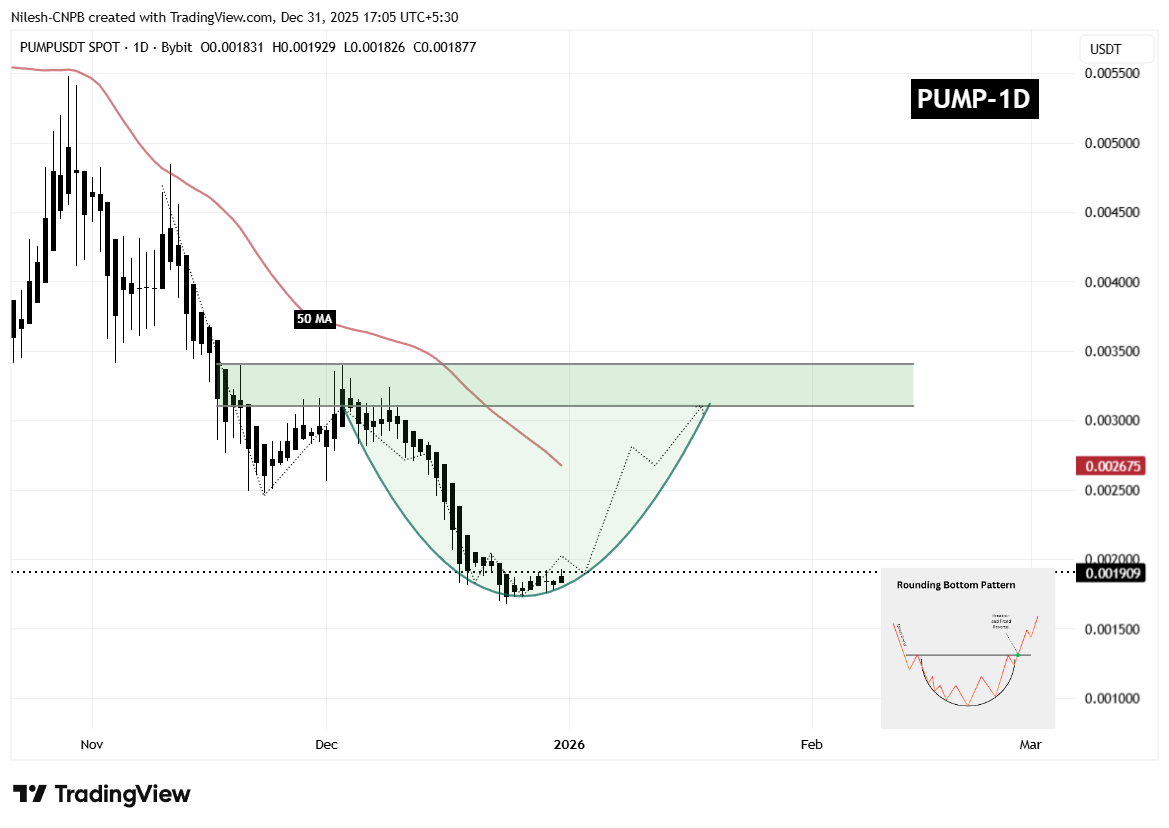
$PUMP Daily Chart/Coinsprobe (Source: Tradingview)
Since establishing this base, PUMP has started to curve higher in a rounded fashion on the chart. This gradual upward arc suggests that selling pressure is fading rather than ending abruptly — a key characteristic of healthier bottoming structures. The recent recovery above the $0.0019 region further supports the idea that accumulation is underway and that market participants are positioning ahead of a larger move.
What’s Next for PUMP?
For the rounding bottom structure to gain confirmation, PUMP needs to reclaim the 50-day moving average, currently hovering near the $0.002675 mark. A sustained move above this level would signal a shift in short-term momentum and reinforce the view that buyers are beginning to regain control after months of corrective price action.
Looking further ahead, the most significant technical barrier remains the neckline resistance around $0.03396. A clean and decisive breakout above this zone would validate the entire reversal pattern and could usher in a broader bullish expansion phase. Such a move would likely attract renewed interest from momentum traders who have remained sidelined during the prolonged downtrend.
Until those levels are reclaimed, the pattern remains in its development phase. Short-term consolidation or minor pullbacks cannot be ruled out, especially if price hesitates near the 50-day moving average. However, as long as PUMP continues to form higher lows and holds above the $0.0017 base, the broader rounding bottom structure remains intact.
Overall, PUMP is approaching a technically significant inflection point. The evolving rounding bottom pattern, improving price structure, and proximity to key resistance levels suggest that the coming sessions could be decisive in determining the token’s next major directional move as the market steps into 2026.
Disclaimer: The views and analysis presented in this article are for informational purposes only and reflect the author’s perspective, not financial advice. Technical patterns and indicators discussed are subject to market volatility and may or may not yield the anticipated results. Investors are advised to exercise caution, conduct independent research, and make decisions aligned with their individual risk tolerance.
About Author: Nilesh Hembade is the Founder and Lead Author of Coinsprobe, with over 5 years of experience in the cryptocurrency and blockchain industry. Since launching Coinsprobe in 2023, he has been providing daily, research-driven insights through in-depth market analysis, on-chain data, and technical research.

Disclaimer: The information on this page may come from third parties and does not represent the views or opinions of Gate. The content displayed on this page is for reference only and does not constitute any financial, investment, or legal advice. Gate does not guarantee the accuracy or completeness of the information and shall not be liable for any losses arising from the use of this information. Virtual asset investments carry high risks and are subject to significant price volatility. You may lose all of your invested principal. Please fully understand the relevant risks and make prudent decisions based on your own financial situation and risk tolerance. For details, please refer to
Disclaimer.
Related Articles
Retail investors are not trading cryptocurrencies but stocks? Cryptocurrency market liquidity is moving to the US stock market, AI helps interpret financial reports and boosts confidence
Wintermute's research indicates that retail cryptocurrency funds are flowing heavily into the US stock market, reversing the correlation to become negatively correlated. As liquidity in the crypto market declines, retail investors prefer mature stock markets, aided by generative AI enhancing their investment capabilities. Cryptocurrencies are gradually becoming part of asset allocation.
CryptoCity1h ago
ETH drops 1.36% in 15 minutes: Deteriorating macro sentiment and liquidity crunch trigger spot selling pressure
From 02:45 to 03:00 on March 8, 2026 (UTC), ETH prices fluctuated sharply within the range of 1,936.0 to 1,969.18 USDT. The 15-minute candlestick yield was -1.36%, with an amplitude of 1.68%. The short-term downtrend intensified, market attention significantly increased, trading activity was high, and panic sentiment dominated.
The main driver of this anomaly was the widespread decline in global risk assets and escalating extreme panic sentiment. Major US stock indices experienced a sharp pullback, and the VIX fear index soared to 29.49 (+24.17%), leading to
GateNews2h ago
BTC drops 0.71% in 15 minutes: Weak macro data and miner sell-off resonate, increasing selling pressure
2026-03-08 02:45 to 03:00 (UTC), Bitcoin (BTC) price candlestick data shows a 15-minute return of -0.71%, with the lowest at 66,837.0 USDT and the highest at 67,402.7 USDT, with an amplitude of 0.84%. Short-term volatility has attracted market attention, with on-chain risk signals rising to 0.84, above the historical average, indicating cautious investor sentiment and increased market fluctuations.
The main driver of this anomaly is the US February employment data, which significantly underperformed expectations, with a sharp decrease in new jobs and the unemployment rate rising to 4.4%, combined with the US
GateNews2h ago
The US-Iran conflict enters the second phase: Trump emphasizes "no ground action for now," airstrikes have destroyed over 3,000 targets, Bitcoin drops to 67,000.
Trump stated that the U.S. military currently has no plans to deploy ground troops, mainly conducting airstrikes, and has destroyed over 3,000 Iranian military targets. Market risk aversion has increased, with Bitcoin dropping to $67,000. The fighting continues between both sides, and Iran has vowed to retaliate.
動區BlockTempo3h ago
PEPE faces volatility risk as the threat of a "short squeeze" increases
The memecoin market is experiencing a significant downturn as the total industry capitalization has dropped by 48% over the past year and declined another 6.9% in the most recent month, according to data from CoinMarketCap. Meanwhile, a report from Glassnode indicates that this sector has only grown modestly by 2.2% in the past t
TapChiBitcoin3h ago