
Date: Wed, Dec 31, 2025 | 03:40 PM GMT
As the final hours of 2025 approach, the broader cryptocurrency market is showing modest strength. Both Bitcoin (BTC) and Ethereum (ETH) are trading slightly in the green, helping ease recent volatility and stabilize overall market sentiment. This calmer environment has allowed select altcoins — including Plasma (XPL) — to begin forming constructive technical setups after extended periods of downside pressure.
XPL is starting to attract attention with an impressive 11% daily jump, trimming its 60-day decline to roughly 43%. While the broader trend still reflects recovery mode, the more important signal is emerging on the daily chart, where price action is beginning to suggest a meaningful structural shift. If confirmed, this setup could mark the early stages of a bullish continuation heading into the new year.

Source: Coinmarketcap
Rounding Bottom in Play
On the daily timeframe, XPL appears to be forming a textbook rounding bottom pattern — a classic bullish reversal structure that typically develops after a prolonged downtrend. This pattern reflects a slow but steady transition from selling dominance to accumulation, as bearish momentum fades and buyers gradually regain control.
Earlier in the trend, XPL faced strong rejection near the $0.3321 neckline zone, triggering a sharp decline that extended through November and December. That sell-off ultimately found a floor near the $0.1152 level, which has since proven to be a critical demand zone. Repeated defenses of this area prevented further downside and laid the foundation for a potential trend reversal.
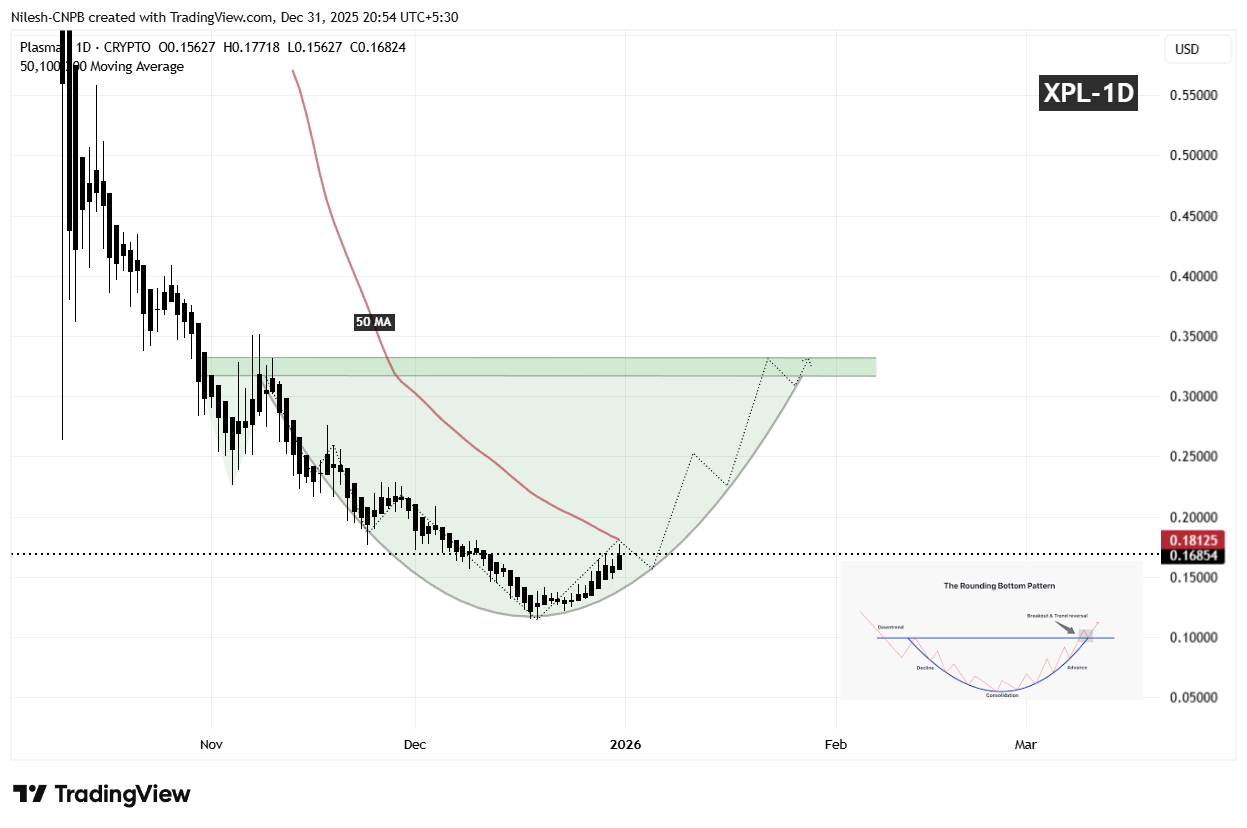
XPL Daily Chart/Coinsprobe (Source: Tradingview)
Since establishing that base, XPL has begun to curve higher in a rounded fashion, mirroring the classic structure of a developing bottom. This gradual recovery suggests that selling pressure is no longer aggressive, and that accumulation is taking place beneath the surface. The recent push back above the $0.16 region further reinforces the idea that buyers are positioning ahead of a larger directional move.
What’s Next for XPL?
For the rounding bottom pattern to gain confirmation, XPL needs to reclaim the 50-day moving average, currently positioned near the $0.1812 level. A sustained move above this area would signal a clear momentum shift and indicate that bulls are regaining control after months of corrective price action.
Looking higher, the most significant technical barrier remains the neckline resistance around $0.3321, highlighted by the prior distribution zone on the chart. A clean breakout above this region would validate the entire reversal structure and could open the door for a broader bullish expansion phase, with momentum traders and sidelined participants likely re-entering the market.
Until those levels are reclaimed, the pattern remains in its development phase. Short-term consolidation or minor pullbacks remain possible if price struggles near the 50-day moving average. However, as long as XPL continues to hold higher lows above the $0.1152 base, the broader bottoming structure remains intact.
Overall, XPL is approaching a technically important inflection point. The emerging rounding bottom formation, improving price structure, and proximity to key resistance levels suggest the coming sessions could prove decisive for Plasma’s next major directional move as the market transitions into 2026.
Disclaimer: The views and analysis presented in this article are for informational purposes only and reflect the author’s perspective, not financial advice. Technical patterns and indicators discussed are subject to market volatility and may or may not yield the anticipated results. Investors are advised to exercise caution, conduct independent research, and make decisions aligned with their individual risk tolerance.
About Author: Nilesh Hembade is the Founder and Lead Author of Coinsprobe, with over 5 years of experience in the cryptocurrency and blockchain industry. Since launching Coinsprobe in 2023, he has been providing daily, research-driven insights through in-depth market analysis, on-chain data, and technical research.

Disclaimer: The information on this page may come from third parties and does not represent the views or opinions of Gate. The content displayed on this page is for reference only and does not constitute any financial, investment, or legal advice. Gate does not guarantee the accuracy or completeness of the information and shall not be liable for any losses arising from the use of this information. Virtual asset investments carry high risks and are subject to significant price volatility. You may lose all of your invested principal. Please fully understand the relevant risks and make prudent decisions based on your own financial situation and risk tolerance. For details, please refer to
Disclaimer.
Related Articles
ETH 15-minute increase of 0.96%: On-chain large-volume buying pressure intensifies amid macro and industry positive developments
From 00:15 to 00:30 on March 10, 2026 (UTC), the price of ETH increased by 0.96% within 15 minutes, with a price range of 1994.66 to 2015.21 USDT, and a volatility of 1.03%. During the same period, market trading activity was active, liquidity flows significantly increased, social attention rose, and volatility intensified.
The main driver of this ETH price fluctuation was the occurrence of multiple large buy orders on-chain. Institutional and large-scale investors concentrated their funds into mainstream trading platforms, with nearly 48,000 ETH in trading volume supporting the rapid price movement.
GateNews12m ago
Cryptocurrency Fear and Greed Index rises to 13 today, and the market remains in a state of extreme panic.
Gate News Report, March 10th, according to Alternative.me data, the cryptocurrency fear and greed index today is 13, up from yesterday's 8, but market sentiment remains in a state of "extreme fear."
GateNews28m ago
Trump says the war will end soon! Oil prices plummet, and the US stock market makes a surprising rebound
U.S. President Trump hinted that the Iran war will end quickly, leading to a rebound in the US stock market and a sharp drop in oil prices. Bitcoin retreated to 68K, and Ethereum is around 2000. MicroStrategy and BitMine continue to buy cryptocurrencies, and the Fear and Greed Index has risen. The market faces uncertainty, with the risk of a stock market crash rising to 35%.
ChainNewsAbmedia52m ago
Bitcoin Gets Its Own ‘Fear Gauge’ as Cboe Announces BITVX Index
Cboe Global Markets is bringing Wall Street’s favorite volatility playbook to bitcoin, announcing plans to launch a new index designed to track the market’s expected price swings using options tied to the popular Ishares Bitcoin Trust ETF.
BITVX: Cboe Applies VIX Methodology to Bitcoin ETF
Coinpedia3h ago
Strategy’s Michael Saylor Reveals $1.28B Bitcoin Purchase, Holdings Reach 738,731 BTC
Michael Saylor, executive chairman of Strategy, posted a brief but blunt update that stopped scrolling feeds: “Strategy has acquired 17,994 BTC for ~$1.28 billion at ~$70,946 per Bitcoin. As of 3/8/2026, we hodl 738,731 $BTC acquired for ~$56.04 billion at ~$75,862 per Bitcoin.” The numbers speak fo
BlockChainReporter3h ago
ETH 15-minute increase of 1.96%: On-chain large fund inflows and technical breakthroughs jointly amplify the rally
2026-03-09 19:15 to 19:30 (UTC), ETH achieved a short-term return of 1.96%, with the price range between 2010.14 and 2050.5 USDT, and an amplitude of 2.01%. Trading volume during this period significantly increased, market attention rapidly grew, and price fluctuations drew high investor interest.
The main driver of this movement was multiple large transfers of over 10,000 ETH on the blockchain, primarily flowing to a major exchange, indicating institutional or large investor accumulation, with positive capital inflows. At 19:15, ETH suddenly
GateNews5h ago