
Date: Sun, Dec 28, 2025 | 11:20 AM GMT
The broader cryptocurrency market is showing modest strength, with both Bitcoin (BTC) and Ethereum (ETH) trading in the green. This steady performance among major assets has helped stabilize overall market sentiment, creating room for select altcoins — including Worldcoin (WLD) — to develop constructive technical setups.
At the time of writing, WLD is trading with a modest intraday gain. More importantly, a notable whale accumulation combined with an improving lower-timeframe structure suggests that momentum may be shifting in favor of the bulls.
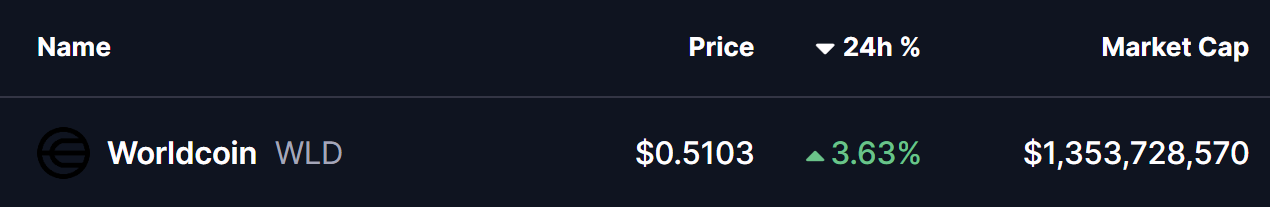
Source: Coinmarketcap
Major Accumulation
On-chain data has added an extra layer of confidence to WLD’s current setup. According to Lookonchain, on December 25, a wallet (0xf000) linked to Multicoin Capital spent $30 million USDC to acquire 60 million WLD at an average price of $0.50 through an OTC deal.
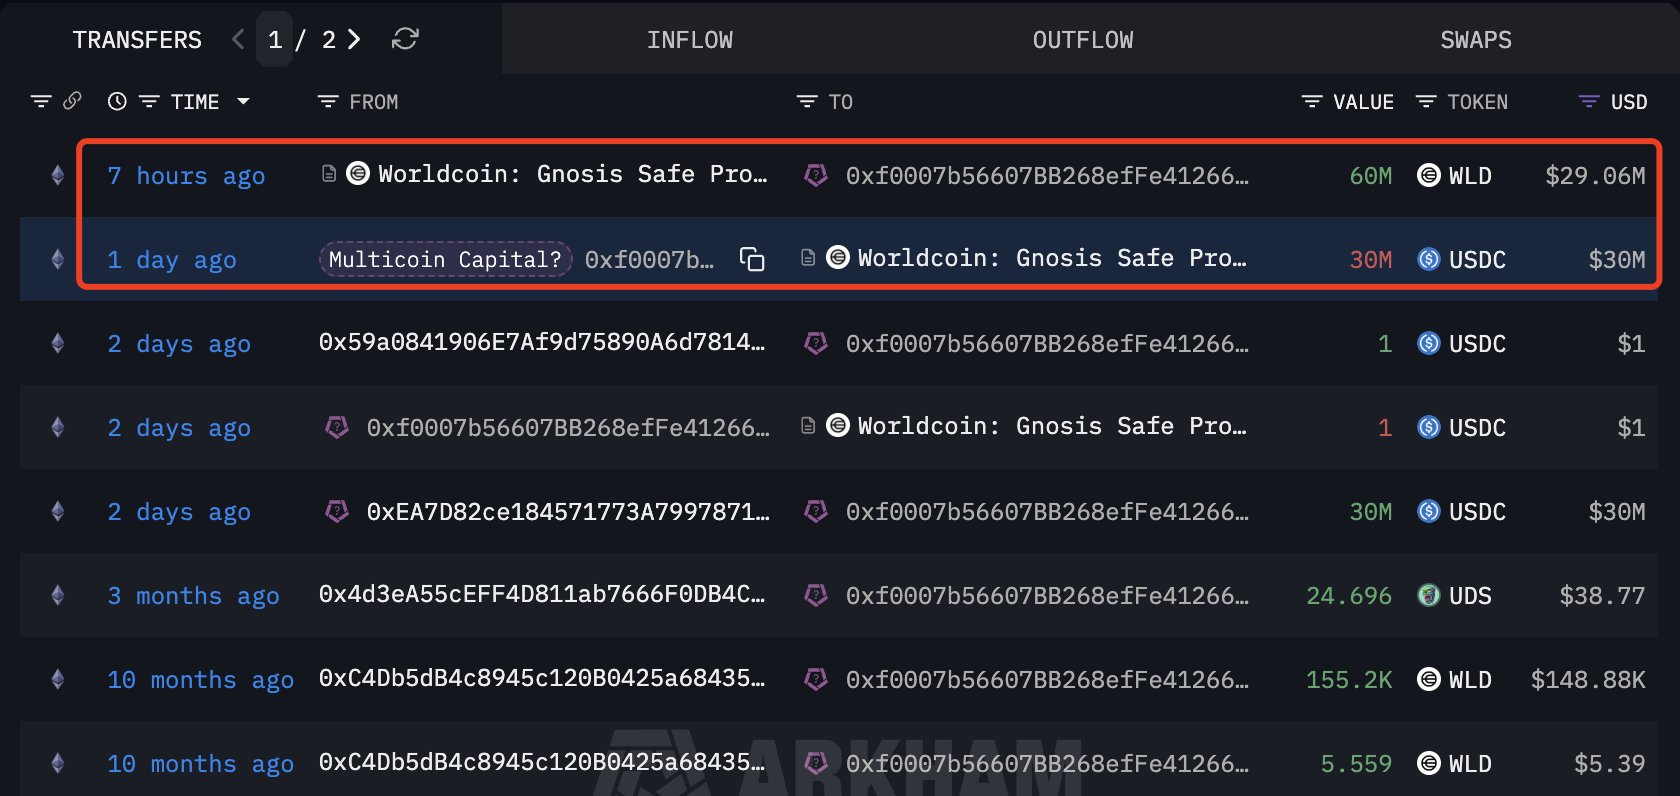
Source: @lookonchain (X)
Such large-scale accumulation near key support levels often signals long-term conviction rather than short-term speculation.
Adam and Eve Pattern in Play
On the 4-hour chart, WLD is forming a textbook Adam and Eve double bottom pattern — a bullish reversal structure that frequently marks the end of downtrends.
The pattern began after WLD faced rejection from the $0.5202–$0.5290 resistance zone. The initial decline was sharp and aggressive, forming the V-shaped “Adam” bottom near the $0.47 region. This was followed by a second, more rounded decline — the “Eve” portion — which bottomed at a similar price level, reinforcing strong demand in that zone.
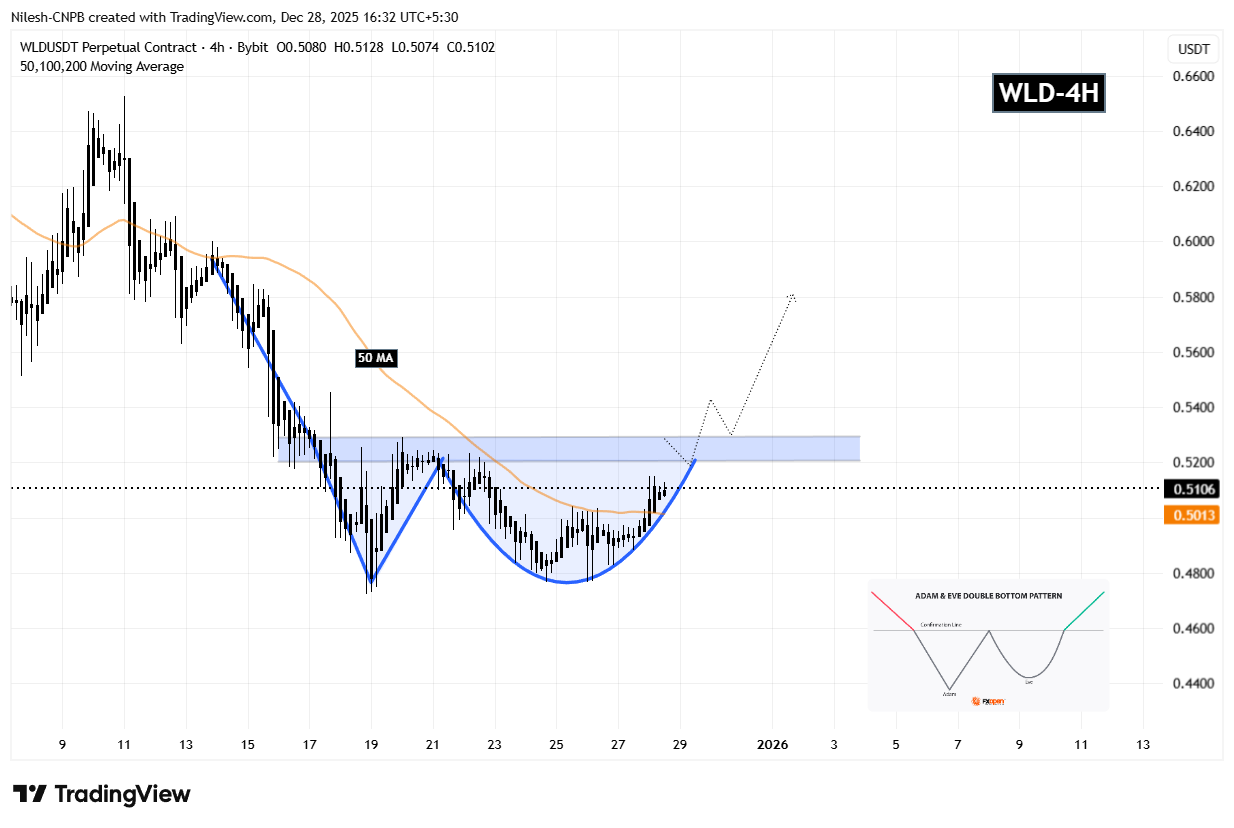
Worldcoin (WLD) 4H Chart/Coinsprobe (Source: Tradingview)
Since completing the second bottom, WLD has steadily pushed higher, reclaimed the 50-period moving average, and is now carving out the right side of the structure near $0.5106. Price is currently pressing against the neckline area, signaling that a decisive move may be approaching.
What Next for WLD?
If WLD continues to hold above the 50 MA support near $0.5013, the bullish structure remains intact. A clean breakout above the $0.5290 neckline, ideally followed by a successful retest, would confirm the Adam and Eve pattern.
Once confirmed, the projected measured move points toward the $0.58 region, suggesting a potential upside of roughly 13% from current levels. This aligns closely with the projected path shown on the chart and would mark a meaningful trend shift on the lower timeframe.
On the flip side, failure to hold the 50 MA could delay the breakout scenario and keep WLD range-bound in the near term. As long as that support holds, however, the technical bias remains tilted to the upside.
Disclaimer: The views and analysis presented in this article are for informational purposes only and reflect the author’s perspective, not financial advice. Technical patterns and indicators discussed are subject to market volatility and may or may not yield the anticipated results. Investors are advised to exercise caution, conduct independent research, and make decisions aligned with their individual risk tolerance.
About Author: Nilesh Hembade is the Founder and Lead Author of Coinsprobe, with over 5 years of experience in the cryptocurrency and blockchain industry. Since launching Coinsprobe in 2023, he has been providing daily, research-driven insights through in-depth market analysis, on-chain data, and technical research.

Disclaimer: The information on this page may come from third parties and does not represent the views or opinions of Gate. The content displayed on this page is for reference only and does not constitute any financial, investment, or legal advice. Gate does not guarantee the accuracy or completeness of the information and shall not be liable for any losses arising from the use of this information. Virtual asset investments carry high risks and are subject to significant price volatility. You may lose all of your invested principal. Please fully understand the relevant risks and make prudent decisions based on your own financial situation and risk tolerance. For details, please refer to
Disclaimer.
Related Articles
Aster Price Nears $0.79 Breakout as Reversal Pattern Strengthens
Key Insights
Aster price structure shows an inverse head and shoulders pattern forming beneath $0.79 resistance, signaling growing buying pressure and possible trend reversal ahead.
Repeated tests of the $0.79 neckline suggest weakening selling pressure as buyers steadily absorb supply
CryptoFrontNews1h ago
The HYPE price could surge despite the upcoming $2.8 million short squeeze.
The recent price movements of Hyperliquid (HYPE) are characterized by stagnation around 30 USD. A symmetrical triangle pattern indicates potential for a breakout in either direction, but market sentiment is cautious. Short squeeze risks may boost prices, while weak market flow and deteriorating demand pose challenges. The token could face significant support levels if it dips below 30 USD. An improved market sentiment could lead to a breakout above 33 USD, sparking recovery momentum.
TapChiBitcoin1h ago
Ethereum Price Holds Key Support: Is $2,200 the Next Test for ETH?
March 6, 2026 7:15 pm EST
TheCoinRepublic3h ago
Cardano Price Trends: Bulls Eye Opportunity as Indicator Flashes Green
ADA: Trading near $0.27, facing resistance at $0.28 and support at $0.26.
Technical Indicators: RSI and MACD show weak momentum, signaling short-term consolidation and cautious trading.
Macro Outlook: Rising PMI and historical patterns suggest potential bullish rebound if resistance
CryptoNewsLand4h ago
CryptoQuant: Bitcoin NUPL--MVRV indicator reaches 0.33, or has entered the mid-stage of a bear market
Gate News Announcement, March 7th, CryptoQuant analyst Axel pointed out on the X platform that the Bitcoin NUPL--MVRV harmonic composite indicator has reached 0.33, while historical cycle bottoms typically occur around the 0.5 range. The chart shows that the bear market cycle is beginning to shift upward, indicating that Bitcoin may have entered the mid-stage of this bear market cycle, suggesting that extreme selling conditions are easing. However, this indicator is still well above historical bottom levels, implying that a market-wide bottom has not yet been confirmed.
GateNews4h ago
ZEC Price Analysis: Upcoming Trends and Targets for the Next Few Weeks
ZEC: Stabilized near $200 support, rebounding toward $250 resistance after prolonged bearish pressure.
Technical Indicators: RSI and MACD show gradual improvement, signaling moderate bullish momentum returning.
Market Outlook: Sustained above $240 could push ZEC toward $268, while
CryptoNewsLand5h ago