 Kaspa (KAS) is starting January 2026 in a quiet but important spot. The network closed December with a solid set of updates, including a new HTX listing and fresh on-chain activity, yet the price has not reacted in a big way. The KAS price now trades around $0.04265, stuck in a tight range after a long pullback.
Price action looks tired rather than broken. The selling pressure that defined the last few months has slowed, and the market is now waiting for a reason to move in either direction.
However, the Kaspa price is still feeling the weight of its broader downtrend. Over the past 90 days, price is down about 46%, and December mostly played out as consolidation above $0.04.
The HTX listing added new liquidity and opened access to a large Asian user base, but it also introduced margin trading, which kept volatility elevated.
At the same time, Kaspa’s ecosystem continues to expand with tools like K Social and higher transaction throughput after the Crescendo upgrade. For now, fundamentals are improving faster than price.
Kaspa (KAS) is starting January 2026 in a quiet but important spot. The network closed December with a solid set of updates, including a new HTX listing and fresh on-chain activity, yet the price has not reacted in a big way. The KAS price now trades around $0.04265, stuck in a tight range after a long pullback.
Price action looks tired rather than broken. The selling pressure that defined the last few months has slowed, and the market is now waiting for a reason to move in either direction.
However, the Kaspa price is still feeling the weight of its broader downtrend. Over the past 90 days, price is down about 46%, and December mostly played out as consolidation above $0.04.
The HTX listing added new liquidity and opened access to a large Asian user base, but it also introduced margin trading, which kept volatility elevated.
At the same time, Kaspa’s ecosystem continues to expand with tools like K Social and higher transaction throughput after the Crescendo upgrade. For now, fundamentals are improving faster than price.
- What the Kaspa Chart Is Showing
- What Market Indicators Are Saying
- KAS Price Short-Term Outlook for January 2026
What the Kaspa Chart Is Showing
On the 4h chart, Kaspa remains in a clear downtrend that began in October. Lower highs are still in place, and every bounce so far has been sold into.
That said, the structure has changed. The sharp sell-off in October was followed by weeks of sideways movement rather than another leg down. The KAS price has been rotating between roughly $0.041 and $0.045, with buyers consistently stepping in near the $0.040–$0.042 area.
This kind of action usually signals balance. Sellers are no longer in full control, but buyers are not ready to push price higher yet.
A clean break above $0.048 would be the first sign that the trend is shifting. Until then, Kaspa remains in recovery mode, not an uptrend.
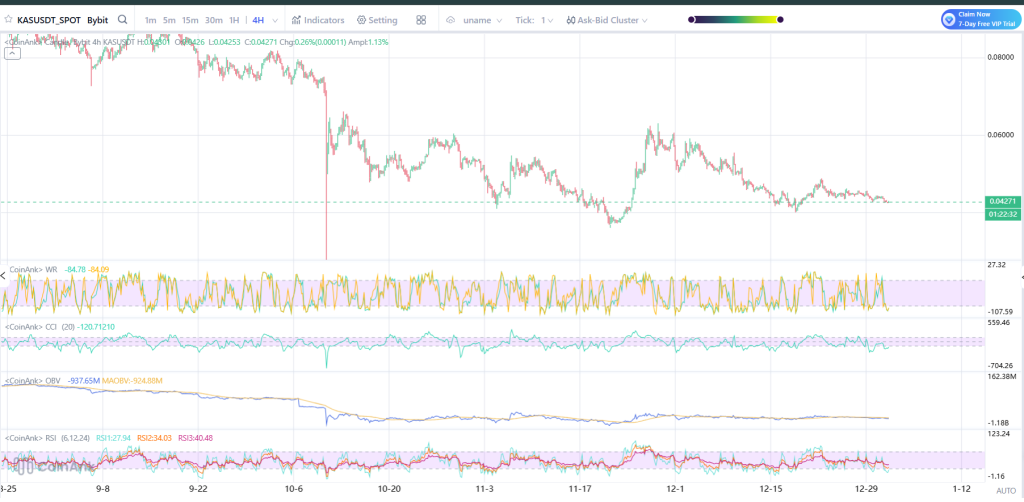
Source: Coinank
What Market Indicators Are Saying
Momentum oscillators portray a similar indecision. The RSI on a 4-hour graph is in the lower 30s. The indicator is nearing an oversold reading, but there isn’t a strong indication of bull divergent signals yet. This implies a slowing of downward pressure, not a reversal.
The CCI stays highly negative and volatile and matches the price movement behavior that has been choppy and has exhibited temporary reversals.
_Read Also: _****Here’s Why Cardano’s Midnight and XRP Together Could Break the Banking Model
The OBV has also consolidated after a long period of decline. The volume is not declining but nor is it increasing. It indicates a halt in the distribution process but not a buying process.
Williams %R remains fluctuating between the oversold and neutrality regions, confirming that Kaspa’s market is range-bound rather than trending. Overall, the market indicators are supportive of the consolidation phase and not the breakout phase.
KAS Price Short-Term Outlook for January 2026
Throughout January, KAS is likely to stay in the same range unless the overall market gives it some direction.
As long as the Kaspa price remains above $0.040, there seems little risk. Support beneath that level would focus interest on the $0.036-$0.038 area again, where there had been purchasing interest before.
On the positive side, a move past $0.045 may lead to a test of $0.048. That zone remains a strong resistance area unless trading volume starts to increase.
For now, the KAS price is stabilizing. The network continues to build, but price still needs confirmation before any meaningful January rally can develop.
Disclaimer: The information on this page may come from third parties and does not represent the views or opinions of Gate. The content displayed on this page is for reference only and does not constitute any financial, investment, or legal advice. Gate does not guarantee the accuracy or completeness of the information and shall not be liable for any losses arising from the use of this information. Virtual asset investments carry high risks and are subject to significant price volatility. You may lose all of your invested principal. Please fully understand the relevant risks and make prudent decisions based on your own financial situation and risk tolerance. For details, please refer to
Disclaimer.
Related Articles
SHIB Momentum Fades as Burn Rate Hits Zero and Bearish Trend Deepens
SHIB price weakens as momentum fades and the token trades within a narrow range.
Burn rate stalls for two days, removing a key narrative supporting short-term optimism.
Key support near $0.0000054 now determines whether recovery or deeper decline
CryptoNewsLand1m ago
Hidden "Death Spiral" Risk! Ethereum and Bitmine targeted by short-selling institutions
Ethereum is about to undergo a major upgrade, and the market is highly focused on it. However, short-selling firm Culper Research believes that the Ethereum economic model is failing and warns of a potential "death spiral." They point out that a significant drop in transaction fees and shrinking staking rewards will impact network security. The report also mentions Vitalik Buterin selling Ethereum and questions the market fundamentals, suggesting that Ethereum is facing a new reality.
区块客16m ago
Retail investors are not trading cryptocurrencies but stocks? Cryptocurrency market liquidity is moving to the US stock market, AI helps interpret financial reports and boosts confidence
Wintermute's research indicates that retail cryptocurrency funds are flowing heavily into the US stock market, reversing the correlation to become negatively correlated. As liquidity in the crypto market declines, retail investors prefer mature stock markets, aided by generative AI enhancing their investment capabilities. Cryptocurrencies are gradually becoming part of asset allocation.
CryptoCity2h ago
ETH drops 1.36% in 15 minutes: Deteriorating macro sentiment and liquidity crunch trigger spot selling pressure
From 02:45 to 03:00 on March 8, 2026 (UTC), ETH prices fluctuated sharply within the range of 1,936.0 to 1,969.18 USDT. The 15-minute candlestick yield was -1.36%, with an amplitude of 1.68%. The short-term downtrend intensified, market attention significantly increased, trading activity was high, and panic sentiment dominated.
The main driver of this anomaly was the widespread decline in global risk assets and escalating extreme panic sentiment. Major US stock indices experienced a sharp pullback, and the VIX fear index soared to 29.49 (+24.17%), leading to
GateNews3h ago
BTC drops 0.71% in 15 minutes: Weak macro data and miner sell-off resonate, increasing selling pressure
2026-03-08 02:45 to 03:00 (UTC), Bitcoin (BTC) price candlestick data shows a 15-minute return of -0.71%, with the lowest at 66,837.0 USDT and the highest at 67,402.7 USDT, with an amplitude of 0.84%. Short-term volatility has attracted market attention, with on-chain risk signals rising to 0.84, above the historical average, indicating cautious investor sentiment and increased market fluctuations.
The main driver of this anomaly is the US February employment data, which significantly underperformed expectations, with a sharp decrease in new jobs and the unemployment rate rising to 4.4%, combined with the US
GateNews3h ago