
Date: Sat, Dec 27, 2025 | 06:45 AM GMT
Hyperliquid (HYPE), the native token of the fast-growing decentralized exchange, has been under pressure over the past month, sliding nearly 27% amid broader weakness across the altcoin market. However, recent price action suggests that bearish momentum may be easing. HYPE has turned green today with modest gains, but more importantly, its technical structure is flashing early signs of a potential bullish continuation.

Source: Coinmarketcap
After weeks of consolidation, the token appears to be transitioning from a corrective phase into a possible expansion move, supported by improving market sentiment and a clear breakout on lower timeframes.
Ascending Triangle Breakout
On the 4-hour chart, HYPE had been trading within a well-defined ascending triangle pattern — a bullish structure characterized by higher lows pressing against a flat resistance level. Throughout this consolidation phase, sellers repeatedly defended the $25.66 region, while buyers continued to step in at progressively higher prices, tightening the price range.
That standoff has now resolved to the upside. Bulls successfully pushed HYPE above the $25.66 resistance, triggering a confirmed breakout and driving price toward a local high near $26.43. This move marks a clear shift in short-term momentum and suggests growing confidence among buyers after an extended period of uncertainty.
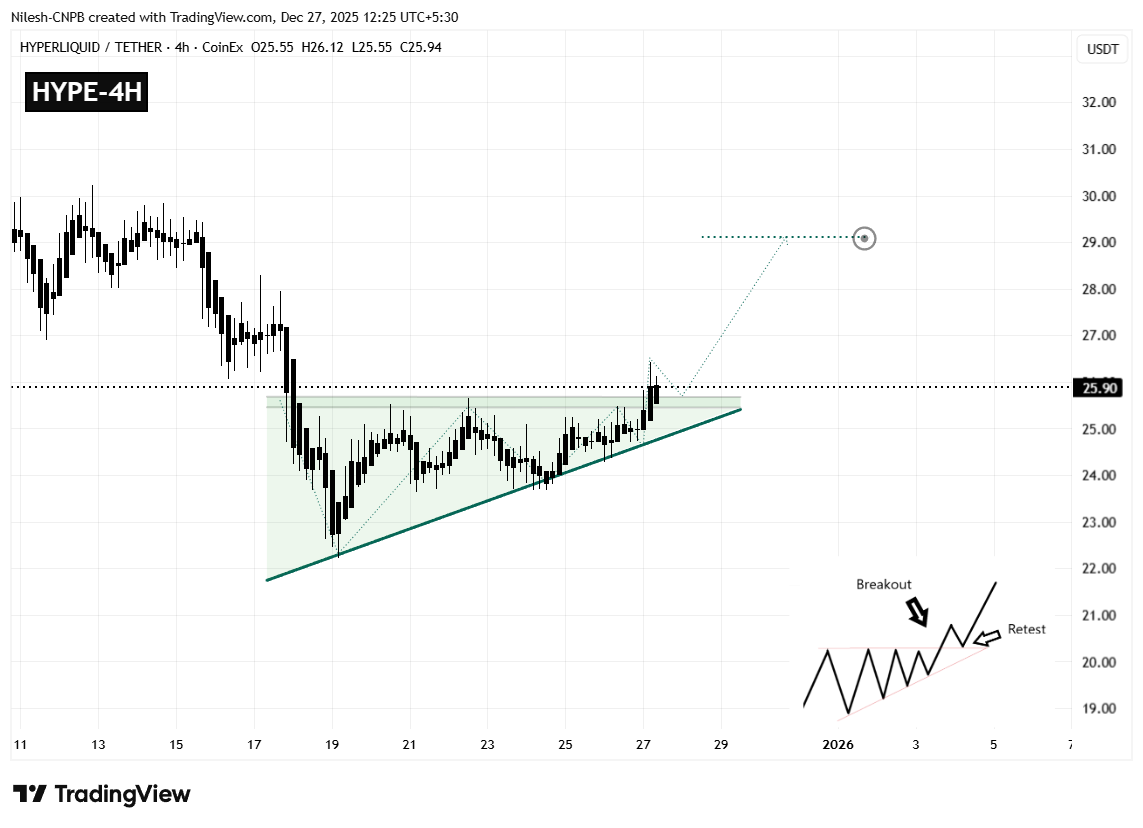
Hyperliquid (HYPE) 4H Chart/Coinsprobe (Source: Tradingview)
The breakout also aligns with the rising trendline support that has guided price higher since the recent swing low, further strengthening the bullish case.
What’s Next for HYPE?
Following a breakout of this nature, a brief pause or pullback is often healthy. In HYPE’s case, the $25.48–$25.66 zone now becomes a key area to watch. A controlled retest of this region — followed by a strong reaction higher — would confirm the former resistance as new support and reinforce the bullish structure.
If that scenario plays out, the chart points toward a potential upside move toward the $29.10 region. This target represents roughly a 12% upside from current levels and aligns with the projected measured move of the ascending triangle.
On the downside, failure to hold above the breakout zone could weaken the bullish outlook. A drop back below the former resistance or a loss of trendline support may expose HYPE to renewed selling pressure, potentially leading to a deeper consolidation before any fresh attempt higher.
For now, the breakout remains intact, and as long as buyers defend the newly reclaimed levels, HYPE appears positioned for a continued recovery move in the sessions ahead.
Disclaimer: The views and analysis presented in this article are for informational purposes only and reflect the author’s perspective, not financial advice. Technical patterns and indicators discussed are subject to market volatility and may or may not yield the anticipated results. Investors are advised to exercise caution, conduct independent research, and make decisions aligned with their individual risk tolerance.
Disclaimer: The information on this page may come from third parties and does not represent the views or opinions of Gate. The content displayed on this page is for reference only and does not constitute any financial, investment, or legal advice. Gate does not guarantee the accuracy or completeness of the information and shall not be liable for any losses arising from the use of this information. Virtual asset investments carry high risks and are subject to significant price volatility. You may lose all of your invested principal. Please fully understand the relevant risks and make prudent decisions based on your own financial situation and risk tolerance. For details, please refer to
Disclaimer.
Related Articles
Solana Nears $95 Resistance With $17B Volume Surge
Solana approaches a key resistance level near $95, with increased trading volume and open interest signaling active trader interest. The token is currently at $90.20, facing potential upward movement if it surpasses $95, but may test $85 if rejected.
CryptoFrontNews20m ago
Bitcoin Slips to $68,000 as Middle East Conflict and US Jobs Data Trigger Sell-Off
Bitcoin surrendered its $70,000 support level, triggering a broader crypto market retreat that wiped out $329 million in leveraged positions. This downturn was fueled by a perfect storm of geopolitical and macroeconomic pressures.
Wiping out the ‘War Gains’
Bitcoin’s midweek resilience
Coinpedia20m ago
PEPE Hovers at Critical $0.053414 Support as $432M Volume Surge Tightens Breakout Watch
PEPE is trading at $0.053416, just above support at $0.053414, with significant trading volume up 22.14%. Resistance is at $0.053676. Despite a slight decrease in price, there’s increased market activity, suggesting potential volatility.
CryptoNewsLand50m ago
DXY Retest at 99.183: Will 100–101 Break as US Degen Index Stabilizes?
DXY trades at 99.183 while retesting the 100–101 monthly resistance zone.
US Degen Index 6900 sits at $0.0001197 with support at $0.0001175 and resistance at $0.0001214.
A break above 101 on DXY would shift structure higher, while rejection keeps price below key resistance.
The U.
CryptoNewsLand54m ago
AVAX Tests $9.38 Resistance After 8.3% Surge — Breakout or Pullback Ahead?
AVAX is also trading at $9.16 with a daily gain of 8.3 per cent, but still below $9.38 resistance.
Strong buyer activity near $8.46 continues to prevent deeper downside extensions.
A daily close above $9.38 could open room toward $9.50, while rejection risks $8.30.
Avalanche’s
CryptoNewsLand1h ago
XRP Holds $1.34 Support as $1.80–$2.00 Becomes 2025 Make-or-Break Zone
XRP is trading at $1.37 and its trading higher than the support of $1.34 but facing a heavy resistance at $1.38.
The critical structural pivot zone of $1.80-2.00 is the critical 2025 structural pivot.
March structure has the targets of $2.78 and 3.60, with anticipated
CryptoNewsLand1h ago