
Date: Thu, Jan 01, 2026 | 06:00 AM GMT
As the new year 2026 begins, the broader cryptocurrency market is showing modest weakness, with both Bitcoin (BTC) and Ethereum (ETH) trading slightly in the red. Despite this soft start among major assets, select altcoins are managing to outperform — including Story (IP), the native token of Story Protocol, a dedicated Layer 1 blockchain focused on decentralized intellectual property infrastructure.
IP is in spotlight with a nearly 6% daily gain, trimming its heavy 60-day decline to around 61%. While the longer-term trend still reflects recovery mode, the more important development is unfolding on the daily chart, where price action is beginning to signal a meaningful structural shift. If this setup plays out as expected, it could mark the early stages of a bullish continuation despite broader market pressure.
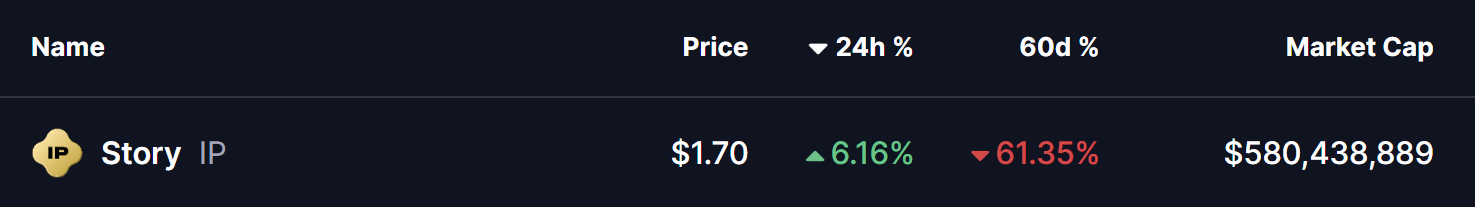
Source: Coinmarketcap
Rounding Bottom in Play
On the daily timeframe, IP appears to be forming a textbook rounding bottom pattern — a classic bullish reversal structure that typically emerges after an extended period of downside pressure. This pattern highlights a gradual transition from distribution to accumulation, where selling momentum fades and buyers begin to step in with increasing confidence.
Earlier in the trend, IP faced strong rejection near the $3.06 neckline zone, triggering a sharp and sustained decline through the final months of 2025. That sell-off eventually found a floor near the $1.42 level, which has since acted as a critical demand zone. Multiple defenses of this area prevented further downside and helped establish a solid base for a potential trend reversal.
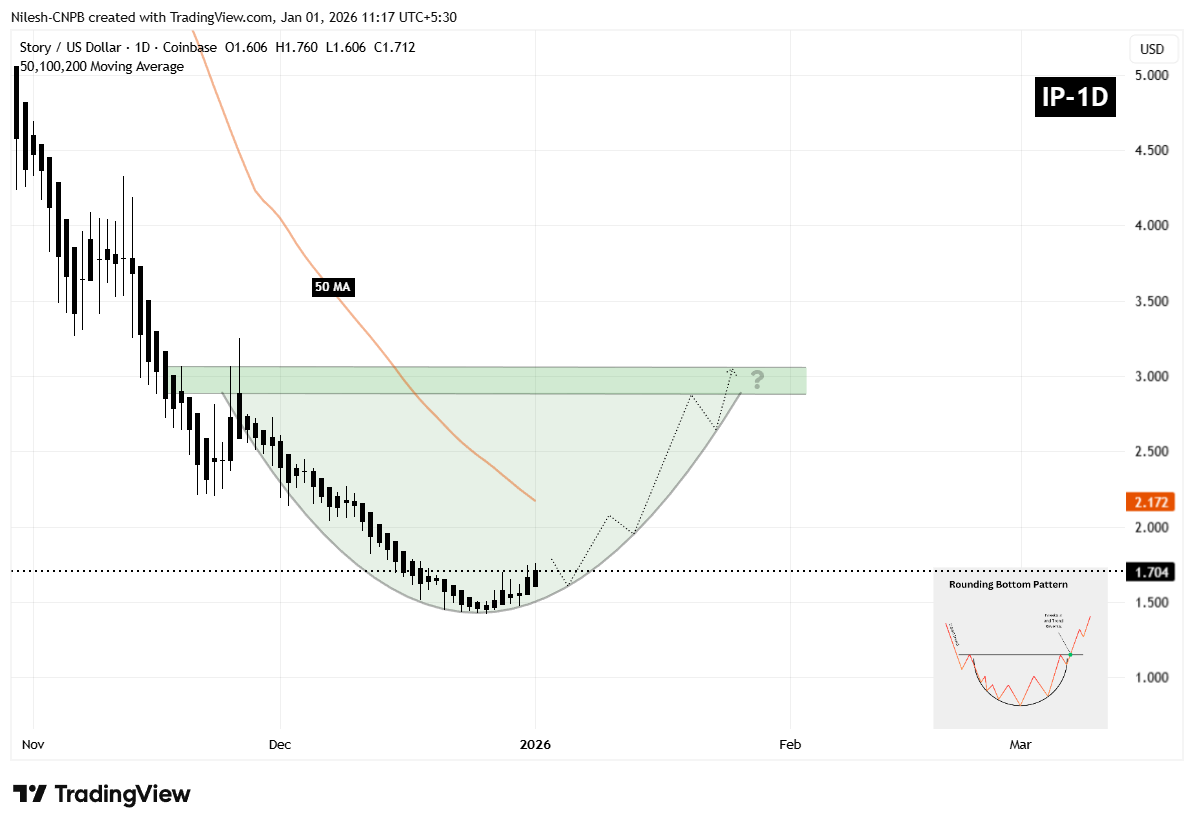
Story (IP) Daily Chart/Coinsprobe (Source: Tradingview)
Since setting that bottom, IP has begun curving higher in a smooth, rounded fashion. This type of price action suggests that selling pressure is no longer aggressive, and that accumulation is quietly taking place. The recent recovery back above the $1.70 region reinforces this view, signaling that the market may be positioning ahead of a larger directional move.
What’s Next for IP?
For the rounding bottom structure to gain confirmation, IP needs to reclaim the 50-day moving average, currently positioned near the $2.172 level. A sustained move above this zone would mark a notable shift in momentum and confirm that buyers are regaining control after months of corrective price action.
Beyond that, the most significant technical barrier remains the neckline resistance around $3.06. A clean and decisive breakout above this area would validate the entire reversal pattern and could open the door for a broader bullish expansion phase, with momentum traders and sidelined participants likely re-entering the market.
Until those levels are reclaimed, the pattern remains in development. Short-term consolidation or minor pullbacks remain possible if IP struggles near the 50-day moving average. However, as long as price continues to form higher lows and holds above the $1.42 base, the broader bottoming structure remains intact.
Overall, IP is approaching a technically important inflection point. The emerging rounding bottom formation, improving price structure, and proximity to key resistance levels suggest the coming sessions could prove decisive for Story’s next major directional move as 2026 gets underway.
Disclaimer: The views and analysis presented in this article are for informational purposes only and reflect the author’s perspective, not financial advice. Technical patterns and indicators discussed are subject to market volatility and may or may not yield the anticipated results. Investors are advised to exercise caution, conduct independent research, and make decisions aligned with their individual risk tolerance.
About Author: Nilesh Hembade is the Founder and Lead Author of Coinsprobe, with over 5 years of experience in the cryptocurrency and blockchain industry. Since launching Coinsprobe in 2023, he has been providing daily, research-driven insights through in-depth market analysis, on-chain data, and technical research.

Disclaimer: The information on this page may come from third parties and does not represent the views or opinions of Gate. The content displayed on this page is for reference only and does not constitute any financial, investment, or legal advice. Gate does not guarantee the accuracy or completeness of the information and shall not be liable for any losses arising from the use of this information. Virtual asset investments carry high risks and are subject to significant price volatility. You may lose all of your invested principal. Please fully understand the relevant risks and make prudent decisions based on your own financial situation and risk tolerance. For details, please refer to
Disclaimer.
Related Articles
SIGN Spikes 61.3% As Bulls Loading Driven By Accelerating Smart Money Inflows
The price of the Sign token is edging higher, showing an interesting development in its market, according to a revelation disclosed today by market analyst AltsDaddy. The crypto asset is roaring back to life, with its price today surged to $0.052055 while its trading volume reached $202,178,087, as
BlockChainReporter3m ago
Today, the cryptocurrency Fear and Greed Index is at 12, indicating the market is in extreme fear.
Gate News Report, March 8th, according to Alternative.me data, today’s cryptocurrency Fear and Greed Index is at 12, indicating the market is in a "Extreme Fear" state. This index measures market sentiment, with lower values indicating higher levels of fear.
GateNews27m ago
CryptoQuant Analyst: Bitcoin NUPL-MVRV indicator reaches 0.33, indicating that extreme selling conditions are moderating
Gate News Announcement, March 8 — CryptoQuant analyst Axel posted on X platform that Bitcoin may have entered the mid-stage of this bear market cycle. Data shows that the NUPL–MVRV harmonic composite indicator has reached 0.33, while historical cycle bottoms typically occur around the -0.5 level. The chart indicates that the start of the bear market cycle is trending upward, suggesting that extreme selling conditions are moderating. However, the indicator remains well above historical bottom levels, indicating that a full-scale market sell-off has not yet been confirmed.
GateNews1h ago
Polkadot to Reset Tokenomics on March 12 With Major DOT Supply and Staking Changes
Polkadot will introduce a new monetary framework on March 12 that sets DOT’s supply cap at 2.1 billion and lowers emissions by 53.6%.
The overhaul will also create a Dynamic Allocation Pool and shorten the DOT unbonding period from 28 days to 24–48 hours.
On March 12, Polkadot will reset
CryptoNewsFlash5h ago
Bitcoin May Be Closer to a Bottom Than Most Think, Chart Signals
The Bitcoin price slipped about 2% today, trading slightly below $68,000 after pushing above $73,000 earlier this week, as already covered on our site. The move added fresh pressure to a market that still feels shaky, especially after several failed attempts to hold higher levels.
Still, not e
CaptainAltcoin5h ago
Dogecoin Monthly Breakdown Pattern Reappears as Price Tests $0.0918
Dogecoin is currently trading at $0.09205 at a gain of 2.3, with support of above $0.08878.
As can be seen in the monthly chart, there are recurring breakdown areas that have been followed by significant expansions in price.
The short-term trading range is narrow and the immediate point o
CryptoNewsLand5h ago