
Date: Wed, Dec 31, 2025 | 09:30 AM GMT
As the final day of 2025 arrives, the broader cryptocurrency market is showing modest strength, with both Bitcoin (BTC) and Ethereum (ETH) trading slightly in the green. This steady performance among major assets has helped stabilize overall market sentiment, creating room for select altcoins — including Chiliz (CHZ) — to develop constructive technical setups.
CHZ is standing out with an impressive 18% daily gain. More importantly, price action has confirmed a technically significant breakout, strengthening the case for further upside in the near term.

Source: Coinmarketcap
Descending Channel Breakout
On the daily chart, Chiliz had been trapped inside a well-defined descending channel since its early December peak near the $0.051 region. This structure was marked by a series of lower highs and lower lows, reflecting persistent bearish pressure that gradually pushed CHZ down toward the $0.028 support area.
That bearish phase now appears to be ending. After reclaiming the 200-day moving average, CHZ decisively broke above the upper boundary of the descending channel near the $0.04451 level. This breakout signals a meaningful shift in market control, with buyers stepping back in after weeks of compression.
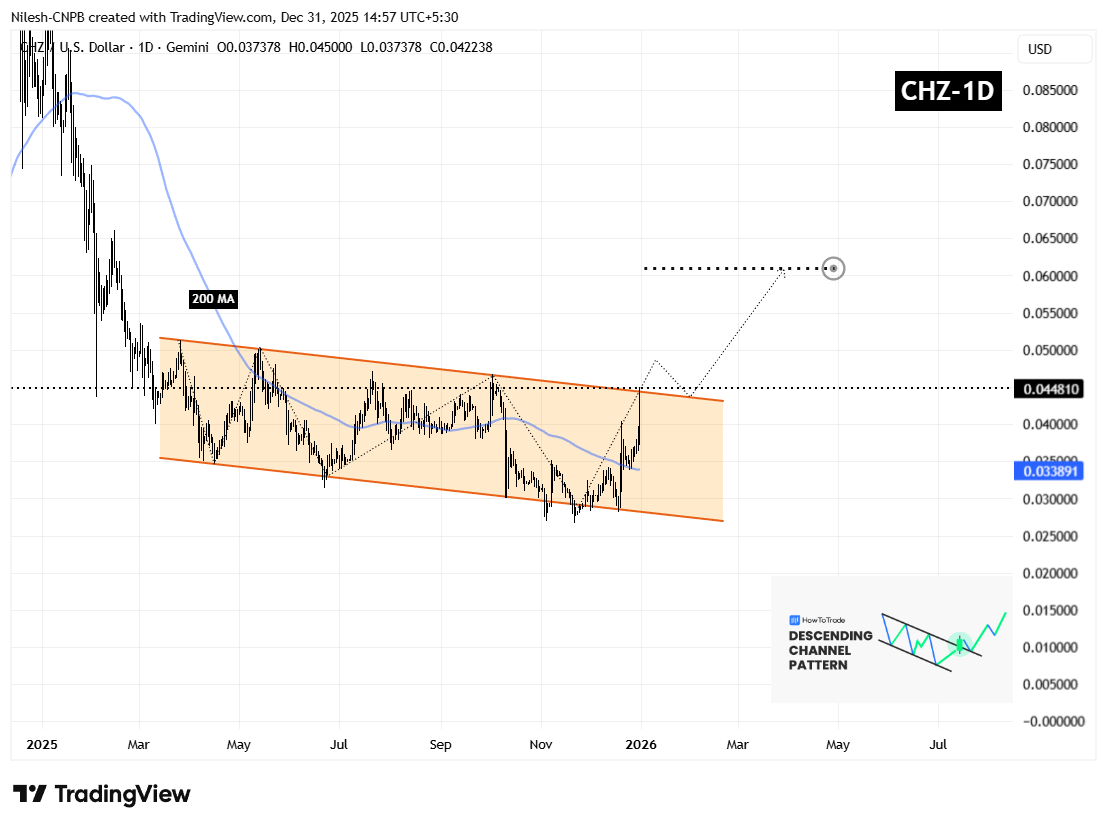
Chiliz (CHZ) Daily Chart/Coinsprobe (Source: Tradingview)
What’s Next for CHZ?
Following a breakout of this nature, short-term volatility is normal. A brief pullback toward the former resistance zone is often considered healthy. For CHZ, the $0.04451 area now stands as a critical support level. A successful retest of this zone, followed by renewed buying interest, would further validate the breakout and strengthen the bullish structure.
If buyers continue to defend reclaimed levels, the chart’s measured move points toward a potential upside target near the $0.06101 region. This would represent roughly a 35% advance from the breakout zone and aligns closely with the projected extension visible on the chart.
On the downside, a failure to hold above the breakout level could slow momentum and lead to consolidation. A sustained move back inside the descending channel would weaken the bullish outlook and delay any upside continuation. However, as long as CHZ remains above reclaimed resistance and the 200-day moving average, the broader technical structure favors higher prices in the sessions ahead.
For now, the breakout remains in its early stages, but CHZ appears well-positioned to extend its recovery move if overall market conditions remain supportive.
Disclaimer: The views and analysis presented in this article are for informational purposes only and reflect the author’s perspective, not financial advice. Technical patterns and indicators discussed are subject to market volatility and may or may not yield the anticipated results. Investors are advised to exercise caution, conduct independent research, and make decisions aligned with their individual risk tolerance.
About Author: Nilesh Hembade is the Founder and Lead Author of Coinsprobe, with over 5 years of experience in the cryptocurrency and blockchain industry. Since launching Coinsprobe in 2023, he has been providing daily, research-driven insights through in-depth market analysis, on-chain data, and technical research.

Disclaimer: The information on this page may come from third parties and does not represent the views or opinions of Gate. The content displayed on this page is for reference only and does not constitute any financial, investment, or legal advice. Gate does not guarantee the accuracy or completeness of the information and shall not be liable for any losses arising from the use of this information. Virtual asset investments carry high risks and are subject to significant price volatility. You may lose all of your invested principal. Please fully understand the relevant risks and make prudent decisions based on your own financial situation and risk tolerance. For details, please refer to
Disclaimer.
Related Articles
NAV Price Surges 44.25%: Is a New Trend Emerging?
NAV coin recently surged by 44.25%, reaching $0.032715, amid increased trading activity and fluctuating market conditions. Analysts attribute this rally to rising on-chain activity and shifting sentiment toward altcoins, while traders monitor key price levels for future movements.
Coinfomania30m ago
Why TARA Just Skyrocketed 24.47% in 60 Minutes
TARA's price surged 24.47% to $0.000047 amid mixed signals in the crypto market and increased trading activity. Market conditions and macroeconomic factors are influencing investor sentiment, with traders closely monitoring key resistance and support levels.
Coinfomania31m ago
XRP Reclaims $1.40 Mark as Price Jumps 6%, Where Is Price Heading? - U.Today
XRP recently surpassed the $1.40 resistance level, driven by a 12.92% spike in trading volume to $2.63 billion. Renewed interest, notably due to a partnership with Mastercard, may help sustain upward momentum, with potential targets of $1.50 and $2. However, a drop below $1.39 could negate this breakout.
UToday1h ago
PI Jumps 16% After V20.2 Upgrade and AI Node Plans
Pi Network completed the V20.2 upgrade, ensuring node alignment and network stability for all operators.
AI node experiments tested decentralized computing, using spare node capacity to handle real AI tasks.
PI price jumped 16%, breaking resistance at $0.23, eyeing $0.28 as key target.
P
CryptoNewsLand2h ago
"Seeking a Sword by Marking a Boat" style coin price predictions go viral: the practical logic and flaws of mystical prophecies
Author: Frank, PANews
Whenever the market enters a confusing phase of stagnation, someone attempts to predict the next trend using a "cutting the cord at the boat" style of historical retrospection method. In such circumstances, people often see from these theories and charts that history is repeating itself, and seem to automatically overlap and verify future market movements with a certain period in the past.
This coincidence appears to have a magical effect and is often verified. Some bloggers claim that the accuracy rate of this type of prediction can reach 75%~80%.
Does this "cutting the cord at the boat" style price prediction that repeatedly goes viral on social media actually help the market identify phases, or is it packaging noise as prophecy?
From "Tick Fractals" to "History Rhymes"
The peak operation regarding the prediction of a market top in October 2025 comes from an analyst named CryptoBullet, who created a method called "tick
PANews2h ago