USDT dominance moved above 6.5% before stalling, suggesting stablecoin inflows may be slowing as traders reassess crypto risk exposure.
Stablecoin metrics are drawing attention as market participants track shifts in crypto liquidity and risk appetite across networks today.
Recent data suggests that Tether (USDT) dominance may be stalling after months of gains, while supply data and market behavior point to a cautious transition phase forming across digital asset markets.
USDT Dominance Consolidates After Prolonged Rise
USDT market cap dominance increased steadily during recent months as volatility pushed traders toward stable assets.
The chart shows dominance climbing from near 4.4% to above 6.5%. This move reflected broad demand for liquidity and reduced exposure to price swings.
USDT dominance appears to have topped after a strong uptrend.
A rollover here would suggest stablecoin demand is peaking, often a sign that capital may start rotating back into risk assets.
If confirmed, this shift could ease sell-side pressure across crypto. pic.twitter.com/shAnsvJf3U
— 0xMarioNawfal (@RoundtableSpace) January 2, 2026
Nonetheless, it also aligned with weaker momentum across Bitcoin and major altcoins.
The current phase shows consolidation rather than continued expansion in dominance. USDT dominance is hovering near 6.17% and moving within a narrow range.
Resistance remains visible near the 6.40% to 6.55% zone. Support continues to form close to the 6.00% level. This sideways movement suggests hesitation rather than renewed risk aversion.
Capital appears parked while traders assess macro signals and market structure.
Therefore, dominance behavior is being monitored closely across trading desks. Any sustained move from this range could set near term direction.
Market Levels Signal Caution and Potential Rotation
Elevated USDT dominance often aligns with limited upside across risk assets. As dominance stays high, rallies in Bitcoin and altcoins face selling pressure.
This pattern reflects cautious positioning and preference for stable liquidity.Furthermore, the pattern suggests that traders remain sensitive to external uncertainty.
A move above resistance would indicate further de risking across crypto markets. Such a shift would likely increase pressure on volatile assets.
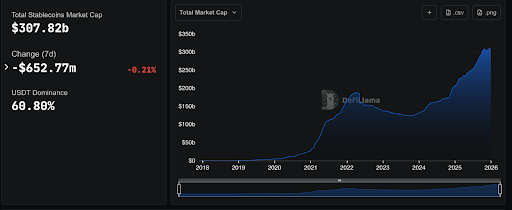
Total Stablecoins Market Cap | Source: DefiLlama
Liquidity would continue flowing toward stablecoins during this scenario. Market participation would remain defensive and selective.
However, a decisive break below the 6.00% level would alter expectations.
Lower dominance often signals renewed appetite for risk exposure. Capital rotation into Bitcoin and altcoins may follow such a move.
This behavior has historically supported broader market recoveries.
Related Reading: Tether Backs SQRIL to Expand Stablecoin-Based Cross-Border Payments
USDT Supply Data And Broader Market Context
At press time, USDT’s price is quoted at $0.9996 showcasing a 0.07% increase over the past 24 hours. Current data places USDT market cap near $187.142 billion.
The total circulating supply stands at 187.215 billion tokens. Unreleased supply is reported near 6.675 billion tokens.
These figures show that issuance has remained controlled during the consolidation period. Supply stability supports orderly market conditions during uncertain phases.
It also limits sudden liquidity shocks across exchanges.
Therefore, dominance changes are driven more by allocation decisions. Tether continues expanding infrastructure beyond trading use cases.
Recent investments focus on payment technology across emerging regions.
These efforts support stablecoin utility while market cycles evolve. Still, dominance trends remain closely tied to trader behavior and asset allocation choices.
Disclaimer: The information on this page may come from third parties and does not represent the views or opinions of Gate. The content displayed on this page is for reference only and does not constitute any financial, investment, or legal advice. Gate does not guarantee the accuracy or completeness of the information and shall not be liable for any losses arising from the use of this information. Virtual asset investments carry high risks and are subject to significant price volatility. You may lose all of your invested principal. Please fully understand the relevant risks and make prudent decisions based on your own financial situation and risk tolerance. For details, please refer to
Disclaimer.
Related Articles
BTC surged to $74,000 before falling back below $69,000, with the total market capitalization evaporating approximately $110 billion.
This week, the cryptocurrency industry received positive news from Wall Street, but Bitcoin's price fell from $74,000 to $69,000, with a market cap evaporating approximately $110 billion. The strength of the US dollar and macroeconomic factors are putting pressure on risk assets. Short-term holders are taking profits, increasing selling pressure, but the US spot Bitcoin ETF recorded net inflows, indicating an improvement in the funding environment.
GateNews2h ago
Today, the cryptocurrency Fear & Greed Index dropped to 12, indicating the market is in extreme fear.
Gate News Report, March 7th, according to Alternative.me data, today the cryptocurrency fear and greed index dropped to 12, indicating the market is in a state of "extreme fear." Yesterday, the index was 18, also in the "extreme fear" zone.
GateNews2h ago
Kaspa Tops CoinMarketCap Community Sentiment With 90% Bullish Votes – Here’s Why
Kaspa’s price hasn’t had the best year. The coin is currently trading around $0.03, and on the yearly chart it’s still down roughly 60%. That kind of drop usually hurts sentiment in most crypto
CaptainAltcoin3h ago
Will XRP Hold $1.33 or Extend Toward $1.30 Before Rebound?
XRP is currently trading at $1.35, experiencing a 1.3% decline. Key support is at $1.34, while resistance is at $1.40. The price is testing around the Fibonacci levels of $1.33 and $1.30, crucial for potential upward movement or deeper decline.
CryptoNewsLand7h ago
Dogecoin Monthly Breakdown Pattern Reappears as Price Tests $0.0918
Dogecoin is currently trading at $0.09205 at a gain of 2.3, with support of above $0.08878.
As can be seen in the monthly chart, there are recurring breakdown areas that have been followed by significant expansions in price.
The short-term trading range is narrow and the immediate point o
CryptoNewsLand7h ago
Solana Nears $95 Resistance With $17B Volume Surge
Solana approaches a key resistance level near $95, with increased trading volume and open interest signaling active trader interest. The token is currently at $90.20, facing potential upward movement if it surpasses $95, but may test $85 if rejected.
CryptoFrontNews7h ago