
Date: Wed, Dec 31, 2025 | 03:40 PM GMT
As the final hours of 2025 approach, the broader cryptocurrency market is showing modest strength. Both Bitcoin (BTC) and Ethereum (ETH) are trading slightly in the green, helping ease recent volatility and stabilize overall market sentiment. This calmer environment has allowed select altcoins — including Plasma (XPL) — to begin forming constructive technical setups after extended periods of downside pressure.
XPL is starting to attract attention with an impressive 11% daily jump, trimming its 60-day decline to roughly 43%. While the broader trend still reflects recovery mode, the more important signal is emerging on the daily chart, where price action is beginning to suggest a meaningful structural shift. If confirmed, this setup could mark the early stages of a bullish continuation heading into the new year.
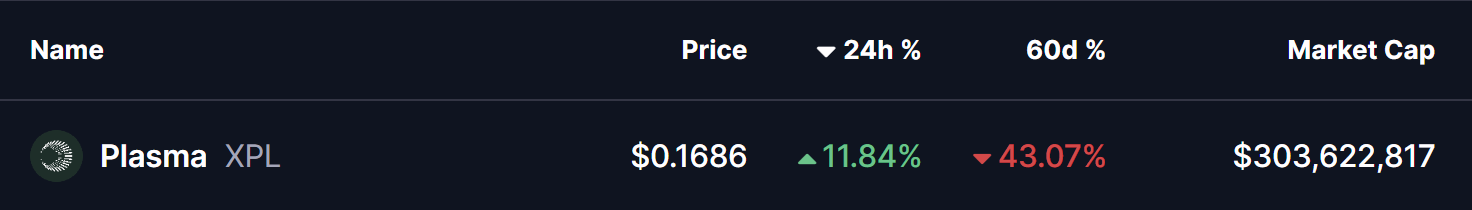
Source: Coinmarketcap
Rounding Bottom in Play
On the daily timeframe, XPL appears to be forming a textbook rounding bottom pattern — a classic bullish reversal structure that typically develops after a prolonged downtrend. This pattern reflects a slow but steady transition from selling dominance to accumulation, as bearish momentum fades and buyers gradually regain control.
Earlier in the trend, XPL faced strong rejection near the $0.3321 neckline zone, triggering a sharp decline that extended through November and December. That sell-off ultimately found a floor near the $0.1152 level, which has since proven to be a critical demand zone. Repeated defenses of this area prevented further downside and laid the foundation for a potential trend reversal.
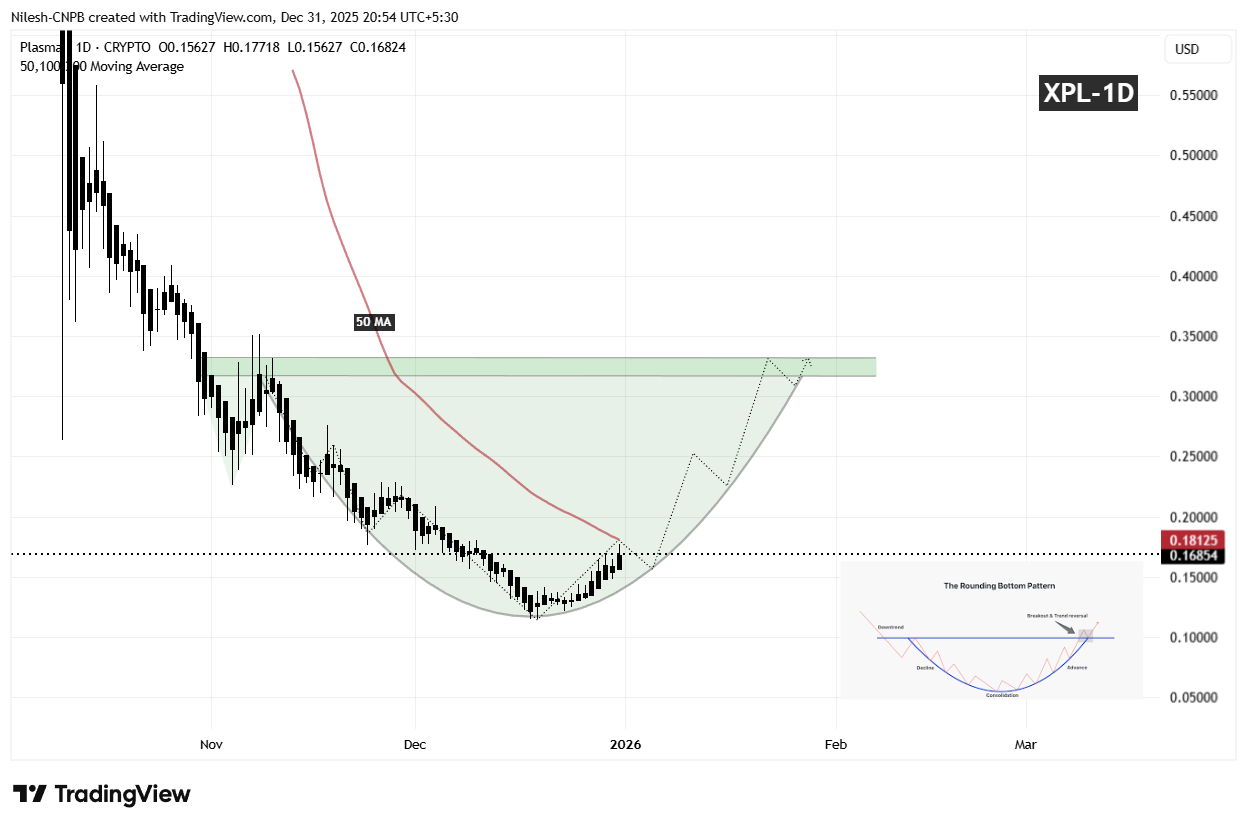
XPL Daily Chart/Coinsprobe (Source: Tradingview)
Since establishing that base, XPL has begun to curve higher in a rounded fashion, mirroring the classic structure of a developing bottom. This gradual recovery suggests that selling pressure is no longer aggressive, and that accumulation is taking place beneath the surface. The recent push back above the $0.16 region further reinforces the idea that buyers are positioning ahead of a larger directional move.
What’s Next for XPL?
For the rounding bottom pattern to gain confirmation, XPL needs to reclaim the 50-day moving average, currently positioned near the $0.1812 level. A sustained move above this area would signal a clear momentum shift and indicate that bulls are regaining control after months of corrective price action.
Looking higher, the most significant technical barrier remains the neckline resistance around $0.3321, highlighted by the prior distribution zone on the chart. A clean breakout above this region would validate the entire reversal structure and could open the door for a broader bullish expansion phase, with momentum traders and sidelined participants likely re-entering the market.
Until those levels are reclaimed, the pattern remains in its development phase. Short-term consolidation or minor pullbacks remain possible if price struggles near the 50-day moving average. However, as long as XPL continues to hold higher lows above the $0.1152 base, the broader bottoming structure remains intact.
Overall, XPL is approaching a technically important inflection point. The emerging rounding bottom formation, improving price structure, and proximity to key resistance levels suggest the coming sessions could prove decisive for Plasma’s next major directional move as the market transitions into 2026.
Disclaimer: The views and analysis presented in this article are for informational purposes only and reflect the author’s perspective, not financial advice. Technical patterns and indicators discussed are subject to market volatility and may or may not yield the anticipated results. Investors are advised to exercise caution, conduct independent research, and make decisions aligned with their individual risk tolerance.
About Author: Nilesh Hembade is the Founder and Lead Author of Coinsprobe, with over 5 years of experience in the cryptocurrency and blockchain industry. Since launching Coinsprobe in 2023, he has been providing daily, research-driven insights through in-depth market analysis, on-chain data, and technical research.
Disclaimer: The information on this page may come from third parties and does not represent the views or opinions of Gate. The content displayed on this page is for reference only and does not constitute any financial, investment, or legal advice. Gate does not guarantee the accuracy or completeness of the information and shall not be liable for any losses arising from the use of this information. Virtual asset investments carry high risks and are subject to significant price volatility. You may lose all of your invested principal. Please fully understand the relevant risks and make prudent decisions based on your own financial situation and risk tolerance. For details, please refer to
Disclaimer.
Related Articles
Hidden "Death Spiral" Risk! Ethereum and Bitmine targeted by short-selling institutions
Ethereum is about to undergo a major upgrade, and the market is highly focused on it. However, short-selling firm Culper Research believes that the Ethereum economic model is failing and warns of a potential "death spiral." They point out that a significant drop in transaction fees and shrinking staking rewards will impact network security. The report also mentions Vitalik Buterin selling Ethereum and questions the market fundamentals, suggesting that Ethereum is facing a new reality.
区块客52m ago
Retail investors are not trading cryptocurrencies but stocks? Cryptocurrency market liquidity is moving to the US stock market, AI helps interpret financial reports and boosts confidence
Wintermute's research indicates that retail cryptocurrency funds are flowing heavily into the US stock market, reversing the correlation to become negatively correlated. As liquidity in the crypto market declines, retail investors prefer mature stock markets, aided by generative AI enhancing their investment capabilities. Cryptocurrencies are gradually becoming part of asset allocation.
CryptoCity2h ago
ETH drops 1.36% in 15 minutes: Deteriorating macro sentiment and liquidity crunch trigger spot selling pressure
From 02:45 to 03:00 on March 8, 2026 (UTC), ETH prices fluctuated sharply within the range of 1,936.0 to 1,969.18 USDT. The 15-minute candlestick yield was -1.36%, with an amplitude of 1.68%. The short-term downtrend intensified, market attention significantly increased, trading activity was high, and panic sentiment dominated.
The main driver of this anomaly was the widespread decline in global risk assets and escalating extreme panic sentiment. Major US stock indices experienced a sharp pullback, and the VIX fear index soared to 29.49 (+24.17%), leading to
GateNews4h ago
BTC drops 0.71% in 15 minutes: Weak macro data and miner sell-off resonate, increasing selling pressure
2026-03-08 02:45 to 03:00 (UTC), Bitcoin (BTC) price candlestick data shows a 15-minute return of -0.71%, with the lowest at 66,837.0 USDT and the highest at 67,402.7 USDT, with an amplitude of 0.84%. Short-term volatility has attracted market attention, with on-chain risk signals rising to 0.84, above the historical average, indicating cautious investor sentiment and increased market fluctuations.
The main driver of this anomaly is the US February employment data, which significantly underperformed expectations, with a sharp decrease in new jobs and the unemployment rate rising to 4.4%, combined with the US
GateNews4h ago