January 2nd, ETF inflows of $645.8 million drive Bitcoin above $91,000. The total cryptocurrency market cap reaches $3.12 trillion, with a daily trading volume of $75 billion. The Fear Index rebounded from extreme panic at 10 in November to neutral at 40, marking the first time since October. Technical breakout of a triangle pattern targets $94,000 to $98,000, with the 50-day moving average crossing above the 100-day moving average confirming an upward trend.
ETF capital inflows tighten supply, creating bullish conditions
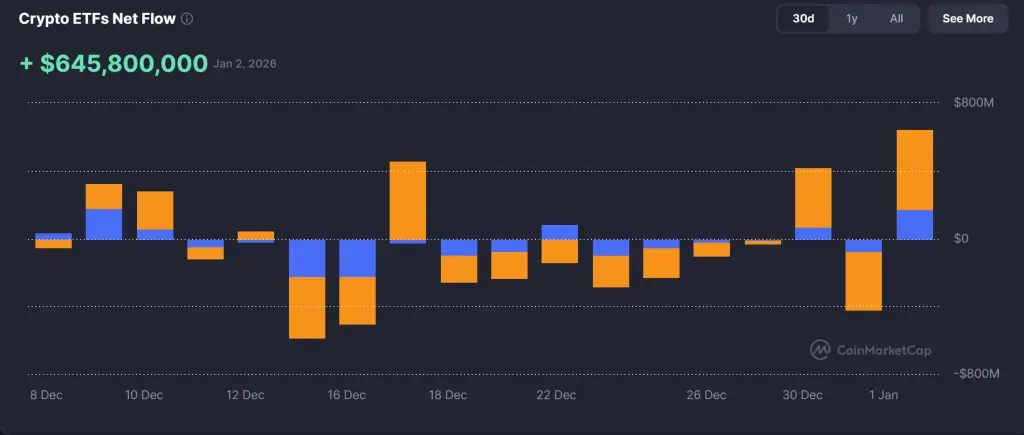
(Source: CMC)
The $645.8 million ETF inflow on January 2nd is the core driver behind today’s Bitcoin rally. Analysts say that, amid still-thin liquidity, ETF demand is tightening supply, creating ideal conditions for price increases. The altcoin season index is at 25, confirming the market remains Bitcoin-dominant, with funds not yet dispersing into other coins.
This concentrated capital flow has formed strong buying pressure. In stark contrast to the panic sell-off at the end of 2025, institutional investors are actively entering the market. The total crypto market cap has reached $3.12 trillion, with daily trading volume approaching $75 billion, indicating market depth is recovering. As a bridge between traditional finance and cryptocurrencies, continued ETF inflows suggest mainstream confidence in Bitcoin is returning.
More importantly, ETF buying behavior is fundamentally different from retail speculation. Institutional investors tend to adopt long-term allocation strategies, holding rather than selling quickly. This “supply locking” effect is especially evident during weekends with lower liquidity, where small buy orders can significantly push prices higher. Analysts note that the lagging of altcoins is not a bad sign; it indicates a more mature bull market rather than mere frantic speculation.
Triangle breakout confirms a new upward cycle
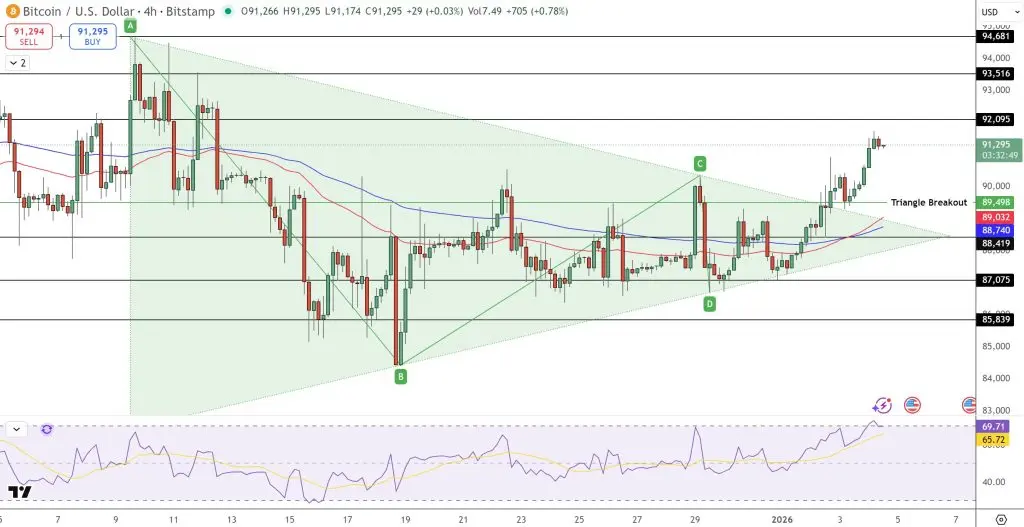
(Source: Trading View)
From a technical perspective, Bitcoin’s price outlook has turned bullish after confirming a breakout from a triangle pattern following a month-long consolidation. Breaking above $89,500 marks the end of December’s sideways trading and signals the start of a new upward trend.
Multiple confirmations from technical indicators
Moving average system turns bullish
· 50-day moving average crosses above the 100-day moving average, confirming increased bullish momentum
· Price trades at $91,260, firmly above both moving averages
· Higher lows, rising volume, and healthy trend
Momentum indicators support bullishness
· Relative Strength Index (RSI) approaches 69, with manageable bullish pressure
· Not yet in overbought territory (above 70), room for further gains
· Bullish engulfing candlestick breaks resistance, confirming bullish dominance
Target price estimates
Short-term target: $93,500 to $94,600
Medium-term target: $98,000
Q1 target: $100,000
The 4-hour chart shows Bitcoin exhibiting a pattern of higher lows and increasing volume. Candlestick signals reinforce the bullish view, with a bullish engulfing candle breaking resistance, followed by a spinning top at $92,000 indicating potential continuation of upward movement after a short consolidation. If Bitcoin can hold above $89,000, next targets are between $93,500 and $94,600, with a potential push toward $98,000 in the coming weeks. However, if the closing price drops below $88,400, Bitcoin could experience a sharp decline and short-term sell-off.
Fear Index turns neutral, signaling emotional recovery
![恐懼與貪婪指數]###https://img-cdn.gateio.im/webp-social/moments-87a9b3933a-7f6c02c46b-8b7abd-e2c905.webp###
(Source: CMC)
Cryptocurrency Fear and Greed Index turned neutral on Sunday, the first time since October, indicating improving investor sentiment. The index is currently at 40, showing investors are no longer panicked but not overly optimistic about the crypto market either. This cautious optimism is characteristic of a healthy bull market.
Looking back at the historic market crash in October, Bitcoin’s price plummeted from a record high of $125,000 to about $80,000, a 35% drop. Altcoins fared worse, with the total market cap of non-ETH and non-BTC altcoins falling roughly 33% in one day. The Fear and Greed Index hit 10 in November, the lowest since 2025, reflecting extreme market panic.
The rebound from extreme panic at 10 to neutral at 40 is itself a key reason for today’s Bitcoin rally. As fear subsides, investors reassess risk-reward, and capitulation-driven sell-offs begin to reverse. More importantly, neutral sentiment leaves room for further upside, as the market has not yet entered greed territory.
Venezuela incident shows resilience with minimal impact
Although the US launched an attack on Venezuela and detained President Maduro on Saturday, Bitcoin’s price remained resilient, contrasting with typical risk assets. Michaël van de Poppe, founder of MN Fund, said on X that he did not expect the Venezuela attack to trigger a broad Bitcoin correction, calling it a long-planned, coordinated attack against Maduro, now in the past.
Typically, risk assets can experience sudden and severe declines due to macroeconomic or geopolitical events. Yet Bitcoin not only held steady but briefly rebounded to $91,000 over the weekend. This resilience indicates Bitcoin is gradually shifting from a pure risk asset to an alternative asset with hedging properties.
However, some worry about potential volatility once stock and commodity markets open on Monday. Analyst Lennaert Snyder wrote on X that geopolitical tensions and the return of major players next week could increase Bitcoin’s volatility after the weekend. An editorial in India’s Economic Times pointed out that, given US direct involvement, unlike the Russia-Ukraine or Israel-Iran conflicts dominating the market in 2025, Wall Street may react instinctively.
If this momentum continues, Bitcoin could soon target $100,000 in Q1 2026, supported by ongoing ETF capital inflows and macro trends turning favorable for digital assets.