
Date: Wed, Dec 31, 2025 | 09:30 AM GMT
As the final day of 2025 arrives, the broader cryptocurrency market is showing modest strength, with both Bitcoin (BTC) and Ethereum (ETH) trading slightly in the green. This steady performance among major assets has helped stabilize overall market sentiment, creating room for select altcoins — including Chiliz (CHZ) — to develop constructive technical setups.
CHZ is standing out with an impressive 18% daily gain. More importantly, price action has confirmed a technically significant breakout, strengthening the case for further upside in the near term.
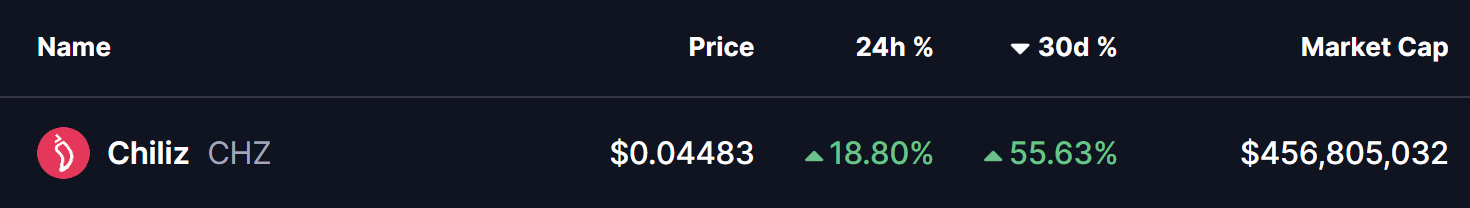
Source: Coinmarketcap
Descending Channel Breakout
On the daily chart, Chiliz had been trapped inside a well-defined descending channel since its early December peak near the $0.051 region. This structure was marked by a series of lower highs and lower lows, reflecting persistent bearish pressure that gradually pushed CHZ down toward the $0.028 support area.
That bearish phase now appears to be ending. After reclaiming the 200-day moving average, CHZ decisively broke above the upper boundary of the descending channel near the $0.04451 level. This breakout signals a meaningful shift in market control, with buyers stepping back in after weeks of compression.
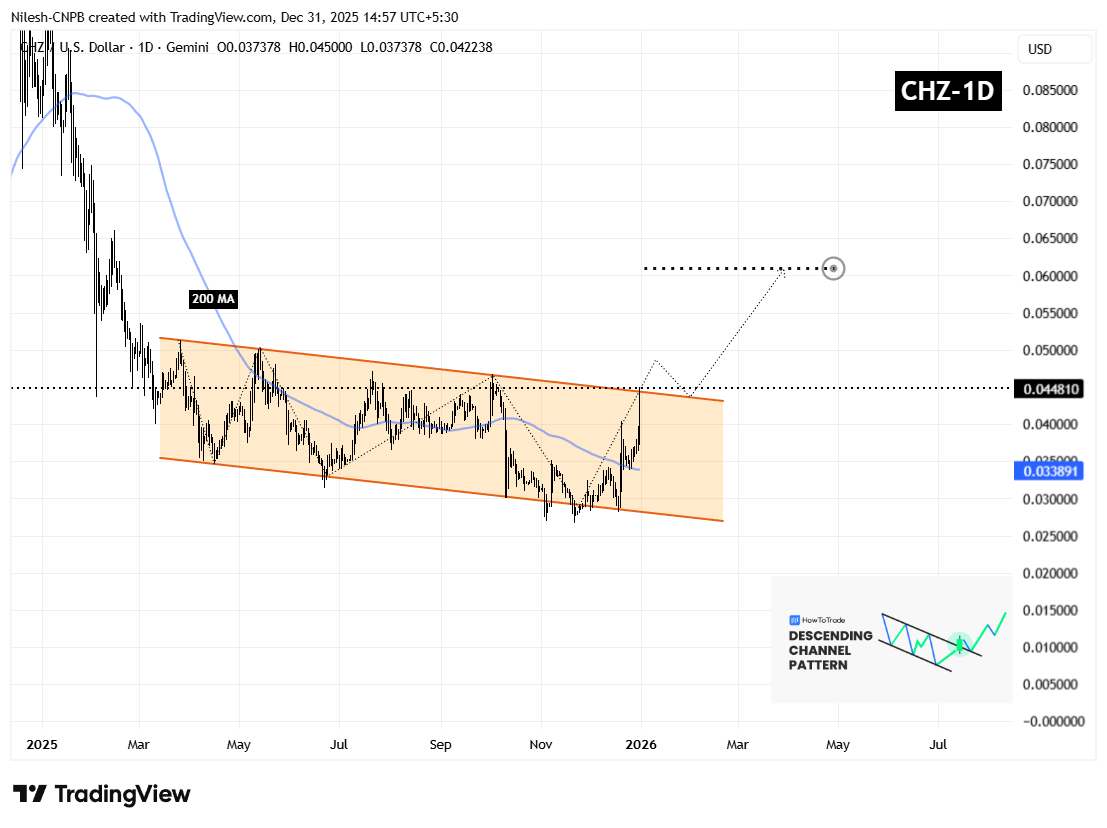
Chiliz (CHZ) Daily Chart/Coinsprobe (Source: Tradingview)
What’s Next for CHZ?
Following a breakout of this nature, short-term volatility is normal. A brief pullback toward the former resistance zone is often considered healthy. For CHZ, the $0.04451 area now stands as a critical support level. A successful retest of this zone, followed by renewed buying interest, would further validate the breakout and strengthen the bullish structure.
If buyers continue to defend reclaimed levels, the chart’s measured move points toward a potential upside target near the $0.06101 region. This would represent roughly a 35% advance from the breakout zone and aligns closely with the projected extension visible on the chart.
On the downside, a failure to hold above the breakout level could slow momentum and lead to consolidation. A sustained move back inside the descending channel would weaken the bullish outlook and delay any upside continuation. However, as long as CHZ remains above reclaimed resistance and the 200-day moving average, the broader technical structure favors higher prices in the sessions ahead.
For now, the breakout remains in its early stages, but CHZ appears well-positioned to extend its recovery move if overall market conditions remain supportive.
Disclaimer: The views and analysis presented in this article are for informational purposes only and reflect the author’s perspective, not financial advice. Technical patterns and indicators discussed are subject to market volatility and may or may not yield the anticipated results. Investors are advised to exercise caution, conduct independent research, and make decisions aligned with their individual risk tolerance.
About Author: Nilesh Hembade is the Founder and Lead Author of Coinsprobe, with over 5 years of experience in the cryptocurrency and blockchain industry. Since launching Coinsprobe in 2023, he has been providing daily, research-driven insights through in-depth market analysis, on-chain data, and technical research.
Disclaimer: The information on this page may come from third parties and does not represent the views or opinions of Gate. The content displayed on this page is for reference only and does not constitute any financial, investment, or legal advice. Gate does not guarantee the accuracy or completeness of the information and shall not be liable for any losses arising from the use of this information. Virtual asset investments carry high risks and are subject to significant price volatility. You may lose all of your invested principal. Please fully understand the relevant risks and make prudent decisions based on your own financial situation and risk tolerance. For details, please refer to
Disclaimer.
Related Articles
Polkadot to Reset Tokenomics on March 12 With Major DOT Supply and Staking Changes
Polkadot will introduce a new monetary framework on March 12 that sets DOT’s supply cap at 2.1 billion and lowers emissions by 53.6%.
The overhaul will also create a Dynamic Allocation Pool and shorten the DOT unbonding period from 28 days to 24–48 hours.
On March 12, Polkadot will reset
CryptoNewsFlash2h ago
Bitcoin May Be Closer to a Bottom Than Most Think, Chart Signals
The Bitcoin price slipped about 2% today, trading slightly below $68,000 after pushing above $73,000 earlier this week, as already covered on our site. The move added fresh pressure to a market that still feels shaky, especially after several failed attempts to hold higher levels.
Still, not e
CaptainAltcoin2h ago
Dogecoin Monthly Breakdown Pattern Reappears as Price Tests $0.0918
Dogecoin is currently trading at $0.09205 at a gain of 2.3, with support of above $0.08878.
As can be seen in the monthly chart, there are recurring breakdown areas that have been followed by significant expansions in price.
The short-term trading range is narrow and the immediate point o
CryptoNewsLand2h ago
Solana Eyes $90.6 Trigger Point as $83 Support Holds and Liquidation Pressure Builds
A large cluster of short positions faces liquidation if SOL reaches $90.6, potentially increasing volatility.
SOL trades between $83.00 support and $89.58 resistance, keeping price action compressed in the short term.
SOL posts a 0.8% daily gain and rises 0.7% against BTC, holding
CryptoNewsLand2h ago
Crypto Market Plunges As Extreme Fear Controls Investor Sentiment
The global crypto market is notably bearish, with a 2.93% drop in market capitalization to $2.32T. Bitcoin and Ethereum saw decreases of 3.07% and 4.01%, respectively. Meanwhile, notable gainers include $XBTC, $TRUMP, and $PEPE. DeFi TVL and NFT sales also declined significantly, while key investments from YZi Labs and Kazakhstan's central bank emerged.
BlockChainReporter3h ago
HBAR at a Crossroads: Will $0.095 Support Trigger a Break Toward $0.106?
HBAR is trading at $0.09739 and above the S/R flip of $0.094-$0.096 in the 12H chart.
The nearest resistance will be at $0.10 with a falling trendline pressure at around $0.104-$0.106.
The support is at $0.095835 and a breakdown at the
CryptoNewsLand3h ago