Cardano (ADA) is maintaining a solid sideways trend around the $0.40 mark as of Monday, after the price convincingly closed above the descending channel pattern last week. The developments in the derivatives market reflect a clear improvement in sentiment, as the open interest (OI) of ADA increased, along with a rise in long positions within the trader community.
Positive Sentiment for Cardano in the Derivatives Market
Data from CoinGlass shows that the open interest (OI) of Cardano futures contracts on exchanges surged to $851.17 million on Monday, up from $644.34 million recorded the previous Tuesday, setting the highest level since mid-December. The strong increase in OI indicates that new capital is actively flowing into the market, reflecting growing demand and potentially serving as a key catalyst, fueling the current bullish trend of ADA.
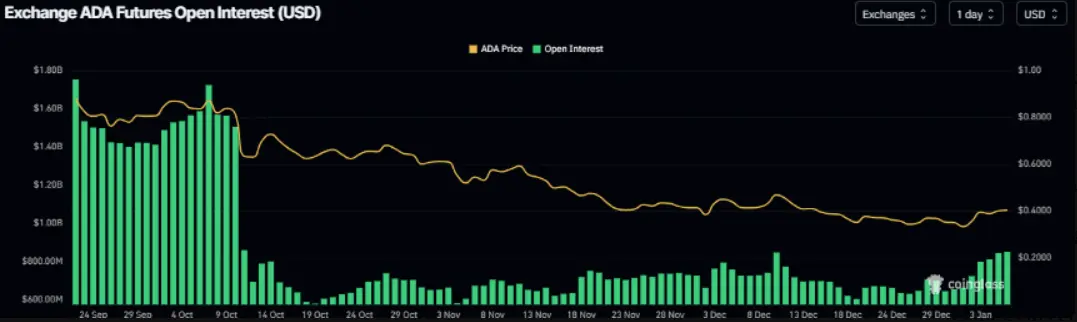 Source: CoinGlass
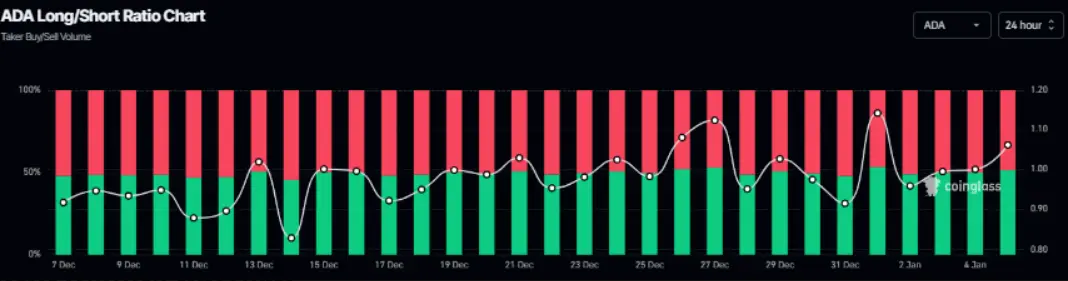
Alongside this, the long/short ratio of Cardano on CoinGlass has also continuously improved, reaching 1.06 on Monday, approaching the highest level of the month. The ratio surpassing 1 suggests that optimistic sentiment is prevailing, as more traders are betting on ADA’s price continuing to rise in the near future.
Source: CoinGlass
Alongside this, the long/short ratio of Cardano on CoinGlass has also continuously improved, reaching 1.06 on Monday, approaching the highest level of the month. The ratio surpassing 1 suggests that optimistic sentiment is prevailing, as more traders are betting on ADA’s price continuing to rise in the near future.
 Source: CoinGlass
Cardano Price Forecast: ADA closes above the channel pattern
The price of Cardano has made an impressive breakout by closing above the upper trendline of the descending channel pattern—a technical structure formed since mid-October by connecting significant peaks and troughs. This upward momentum was maintained gently until Sunday, with ADA trading around the $0.40 level at the start of the week.
In a positive scenario, if Cardano maintains its current momentum, the price could extend its recovery toward the nearest resistance zone at $0.42, coinciding with the 50-day exponential moving average (EMA). A daily close above this level would act as a catalyst, paving the way for further gains toward the important resistance zone at $0.49.
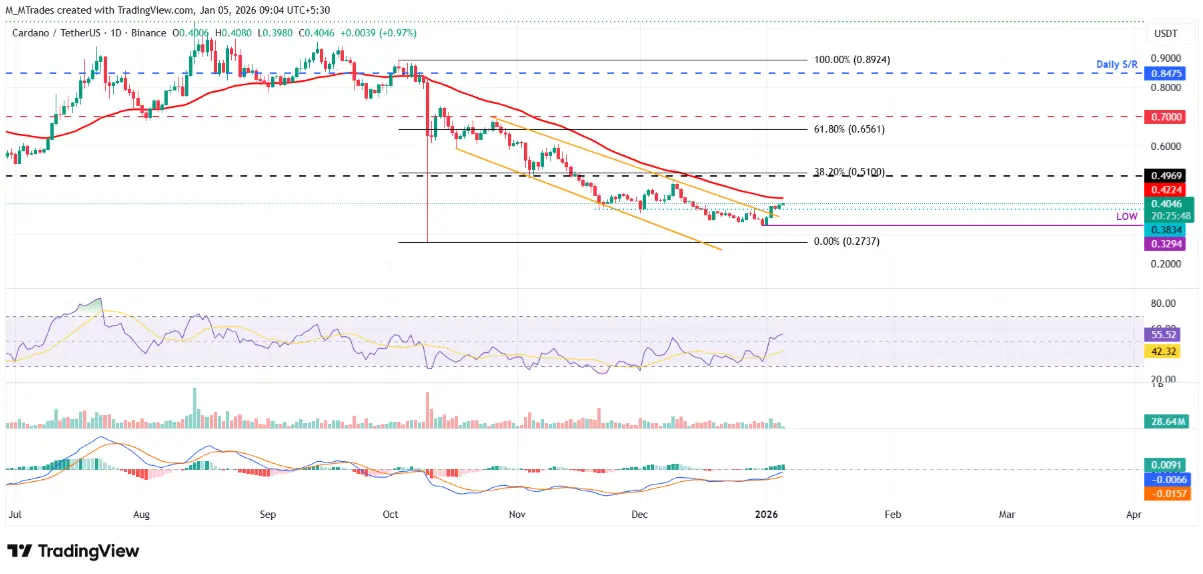 Daily ADA/USDT Chart | Source: TradingView
Technical indicators also support the bullish trend. The Relative Strength Index (RSI) on the daily timeframe is at 55, surpassing the neutral 50 level, indicating that buying pressure is gradually gaining dominance. Meanwhile, the MACD has issued a bullish crossover signal, with expanding green histogram bars above the neutral line, further strengthening the optimistic outlook.
Daily ADA/USDT Chart | Source: TradingView
Technical indicators also support the bullish trend. The Relative Strength Index (RSI) on the daily timeframe is at 55, surpassing the neutral 50 level, indicating that buying pressure is gradually gaining dominance. Meanwhile, the MACD has issued a bullish crossover signal, with expanding green histogram bars above the neutral line, further strengthening the optimistic outlook.
However, if profit-taking pressure emerges, ADA still faces the risk of correction and could retreat to the nearest support zone around the recent low at $0.32.
SN_Nour
Disclaimer: The information on this page may come from third parties and does not represent the views or opinions of Gate. The content displayed on this page is for reference only and does not constitute any financial, investment, or legal advice. Gate does not guarantee the accuracy or completeness of the information and shall not be liable for any losses arising from the use of this information. Virtual asset investments carry high risks and are subject to significant price volatility. You may lose all of your invested principal. Please fully understand the relevant risks and make prudent decisions based on your own financial situation and risk tolerance. For details, please refer to
Disclaimer.
Related Articles
WHITE Holds Firm At $0.00008064 As Its Consolidative Movement Suggests Upcoming 60% Spike Amid Wh...
The WhiteRock (WHITE) coin is attracting market attention with its price momentum, according to a revelation disclosed today by market analyst AltsDaddy. As pointed out by the analyst, WHITE’s price reclaimed the $0.03963149 level while its trading volume surpassed the $3,406,503 mark, signaling
BlockChainReporter15m ago
PEPE Stalls at $0.053354 While Oscillators Drift Below 40 Inside Tight Trading Band
PEPE fell to 2.4 per cent to trade at a price of $0.053354 but above the level of support in the vicinity of $0.053325.
Momentum indicators are tight and oscillator values are close to 39.47 and 36.73 and MACD is close to zero line.
The intra-day range of $0.053325 to $0.053473 is still r
CryptoNewsLand29m ago
No, Bitcoin Is Not Forming 'Cup and Handle' Pattern to $500,000, Says Peter Brandt - U.Today
Peter Brandt, a veteran market analyst, strongly criticizes the prediction of Bitcoin reaching $500,000, arguing it misinterprets the "cup and handle" pattern. He emphasizes the necessity of proper technical analysis and warns against unwarranted optimism based on flawed interpretations.
UToday59m ago
Shiba Inu 658% Jump in Spot Flows as Activity Picks up for SHIB - U.Today
Shiba Inu experienced a 658% surge in spot flows recently, reflecting increased market demand amid a crypto recovery. The current price is $0.000005437, with significant resistance at $0.00000587. Petitions for economic data this week could influence market movements.
UToday1h ago
TARA Price Surges 11.84%: Traders React to Network Activity
TARA's price surged by 11.84% in five minutes, currently trading at $0.000116 with a significant trading volume. Analysts suggest increased network activity and interest from new investors are driving this momentum, affecting broader market trends. Traders are monitoring key support and resistance levels.
Coinfomania1h ago
BTC short-term IV rises above 65%, ETH short-term IV reaches over 80%, both hitting recent highs
This week will release the US February CPI and unemployment data, as well as the January PCE Price Index. Meanwhile, US and Israeli military actions may impact oil transportation through the Strait of Hormuz. The implied volatility of major maturities has risen significantly, with BTC short-term IV exceeding 65%, ETH short-term IV exceeding 80%, and the skew indicator declining.
GateNews1h ago