
The Bittensor (TAO) price has spent the past few weeks doing something it rarely does: moving quietly. After a sharp sell-off that cleared excess leverage, TAO found support, stopped going lower, and began rebuilding from a clear demand zone.
That process has pushed price back into a well-defined area, where the next move is likely to matter.
Top analyst CyrilXBT shared on X that this is how strong narrative-driven coins often behave after a big cycle move. First comes the flush. Then comes structure. The TAO price appears to be in that second phase now.
- What the Bittensor Chart Is Showing
- Why This Looks Like Accumulation
- What Comes Next for TAO Price
What the Bittensor Chart Is Showing
On the daily chart, TAO has carved out a clean range after the late-2025 drawdown. Price dropped hard, shook out weak positions, and then stabilized instead of drifting lower. From there, it started to grind higher without the kind of wild swings that usually come with speculative bounces.
That grind matters. Rather than chopping aimlessly, the TAO price has been pushing back toward a clear breakout zone. The structure is easy to read, with defined support below and resistance above. There’s no mess on the chart, and that’s exactly what stands out.
The recent push higher hasn’t come with explosive volume, which supports the idea that this is accumulation rather than distribution. When sellers step aside and buyers absorb supply quietly, price often tightens before making a decision.
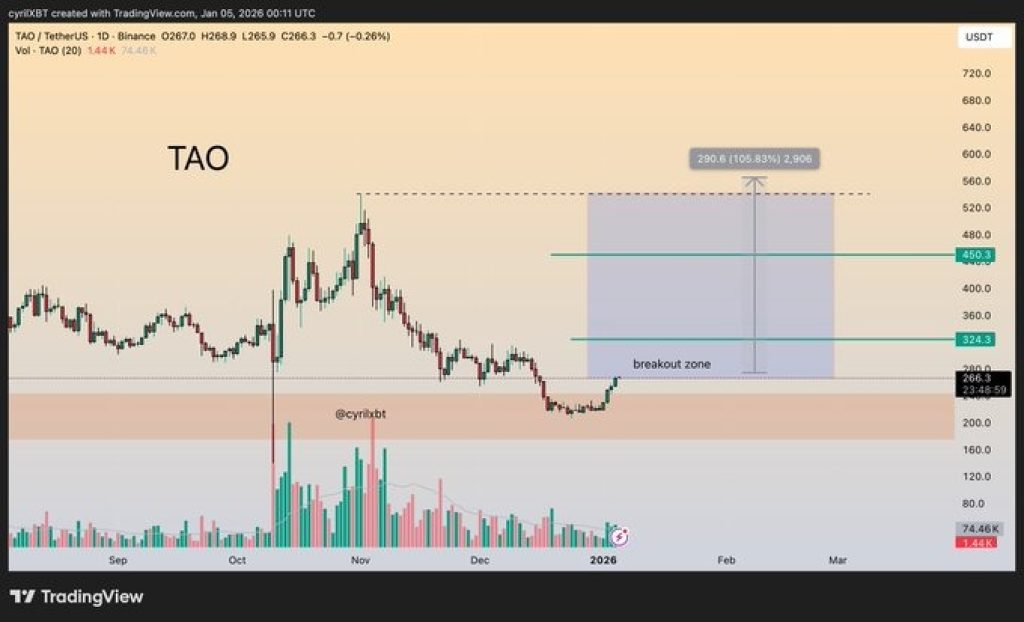
Source: X/CyrilXBT
Why This Looks Like Accumulation
One of the key points in CyrilXBT’s analysis is the lack of chaos. After a major flush, weaker setups usually turn into noisy, sideways action. TAO hasn’t done that. Instead, it found demand quickly and began respecting clear levels.
There’s also a clean invalidation point on the chart. If the TAO price were to lose the lower end of the range, the bullish structure would break. Until that happens, the setup remains intact. That kind of clarity is rare, especially in volatile markets.
TAO also has a history of long periods of inactivity followed by sharp moves. It doesn’t trend often, but when it does, the move tends to be decisive.
_****Here’s Why a Top YouTuber Says $10,000 XRP Is the Wrong Conversation**
What Comes Next for TAO Price
If TAO breaks out of the current range and holds above it, the chart opens up for a measured move higher. With little resistance overhead, momentum could build quickly once price escapes the range.
If the breakout fails, the downside risk remains defined. A rejection would likely send price back into consolidation rather than trigger immediate collapse, as long as demand continues to hold.
For now, the Bittensor price is doing exactly what strong setups do after a reset. It flushed excess, rebuilt the structure, and moved back into a zone where direction will soon be decided. Whether that decision comes this week or later, the chart suggests TAO is getting closer to making it.
Disclaimer: The information on this page may come from third parties and does not represent the views or opinions of Gate. The content displayed on this page is for reference only and does not constitute any financial, investment, or legal advice. Gate does not guarantee the accuracy or completeness of the information and shall not be liable for any losses arising from the use of this information. Virtual asset investments carry high risks and are subject to significant price volatility. You may lose all of your invested principal. Please fully understand the relevant risks and make prudent decisions based on your own financial situation and risk tolerance. For details, please refer to
Disclaimer.
Related Articles
ETH drops 1.36% in 15 minutes: Deteriorating macro sentiment and liquidity crunch trigger spot selling pressure
From 02:45 to 03:00 on March 8, 2026 (UTC), ETH prices fluctuated sharply within the range of 1,936.0 to 1,969.18 USDT. The 15-minute candlestick yield was -1.36%, with an amplitude of 1.68%. The short-term downtrend intensified, market attention significantly increased, trading activity was high, and panic sentiment dominated.
The main driver of this anomaly was the widespread decline in global risk assets and escalating extreme panic sentiment. Major US stock indices experienced a sharp pullback, and the VIX fear index soared to 29.49 (+24.17%), leading to
GateNews43m ago
BTC drops 0.71% in 15 minutes: Weak macro data and miner sell-off resonate, increasing selling pressure
2026-03-08 02:45 to 03:00 (UTC), Bitcoin (BTC) price candlestick data shows a 15-minute return of -0.71%, with the lowest at 66,837.0 USDT and the highest at 67,402.7 USDT, with an amplitude of 0.84%. Short-term volatility has attracted market attention, with on-chain risk signals rising to 0.84, above the historical average, indicating cautious investor sentiment and increased market fluctuations.
The main driver of this anomaly is the US February employment data, which significantly underperformed expectations, with a sharp decrease in new jobs and the unemployment rate rising to 4.4%, combined with the US
GateNews43m ago
The US-Iran conflict enters the second phase: Trump emphasizes "no ground action for now," airstrikes have destroyed over 3,000 targets, Bitcoin drops to 67,000.
Trump stated that the U.S. military currently has no plans to deploy ground troops, mainly conducting airstrikes, and has destroyed over 3,000 Iranian military targets. Market risk aversion has increased, with Bitcoin dropping to $67,000. The fighting continues between both sides, and Iran has vowed to retaliate.
動區BlockTempo1h ago
PEPE faces volatility risk as the threat of a "short squeeze" increases
The memecoin market is experiencing a significant downturn as the total industry capitalization has dropped by 48% over the past year and declined another 6.9% in the most recent month, according to data from CoinMarketCap. Meanwhile, a report from Glassnode indicates that this sector has only grown modestly by 2.2% in the past t
TapChiBitcoin1h ago
Willy Woo: BTC's early decline was too rapid, and it is now creating conditions for a rebound to $85,000.
On March 8th, analyst Willy Woo pointed out that Bitcoin faced resistance near $75,000, but since mid-February, capital flows have been recovering, and market sentiment may shift toward risk appetite. Although there is a short-term rebound opportunity, in the long term, Bitcoin remains in the mid-stage of a bear market and may experience sideways consolidation and test resistance levels.
GateNews2h ago