Over the past week, the price of Cardano (ADA) has increased by nearly 21%, and in the last 24 hours alone, it has risen by about 7%, making it one of the major coins with the most positive developments. This upward momentum was initially considered quite sustainable, as technical signals on the chart indicated an improving trend.
However, upon deeper analysis, the market picture becomes more complex. Although the overall trend still leans towards growth, momentum indicators suggest that the strength of the trend is gradually weakening. Instead of a sharp correction, current data indicate a high likelihood that ADA will enter a sideways accumulation phase before establishing its next direction. Below are detailed analyses of the market signals.
Uptrend maintained, but momentum decreasing on the 12-hour chart
On the 12-hour timeframe, ADA still maintains an uptrend structure. A notable positive signal is the upcoming crossover between the exponential moving averages (EMA), as the 20-period EMA approaches the 50-period EMA. This crossover often signals that the medium-term trend is being reinforced.
However, momentum indicators show signs of stagnation. From December 9 to January 6, ADA’s price was trending downward while the (RSI) increased. This is a hidden bearish divergence—often indicating weakening momentum, with potential short-term correction risks, rather than a trend reversal.
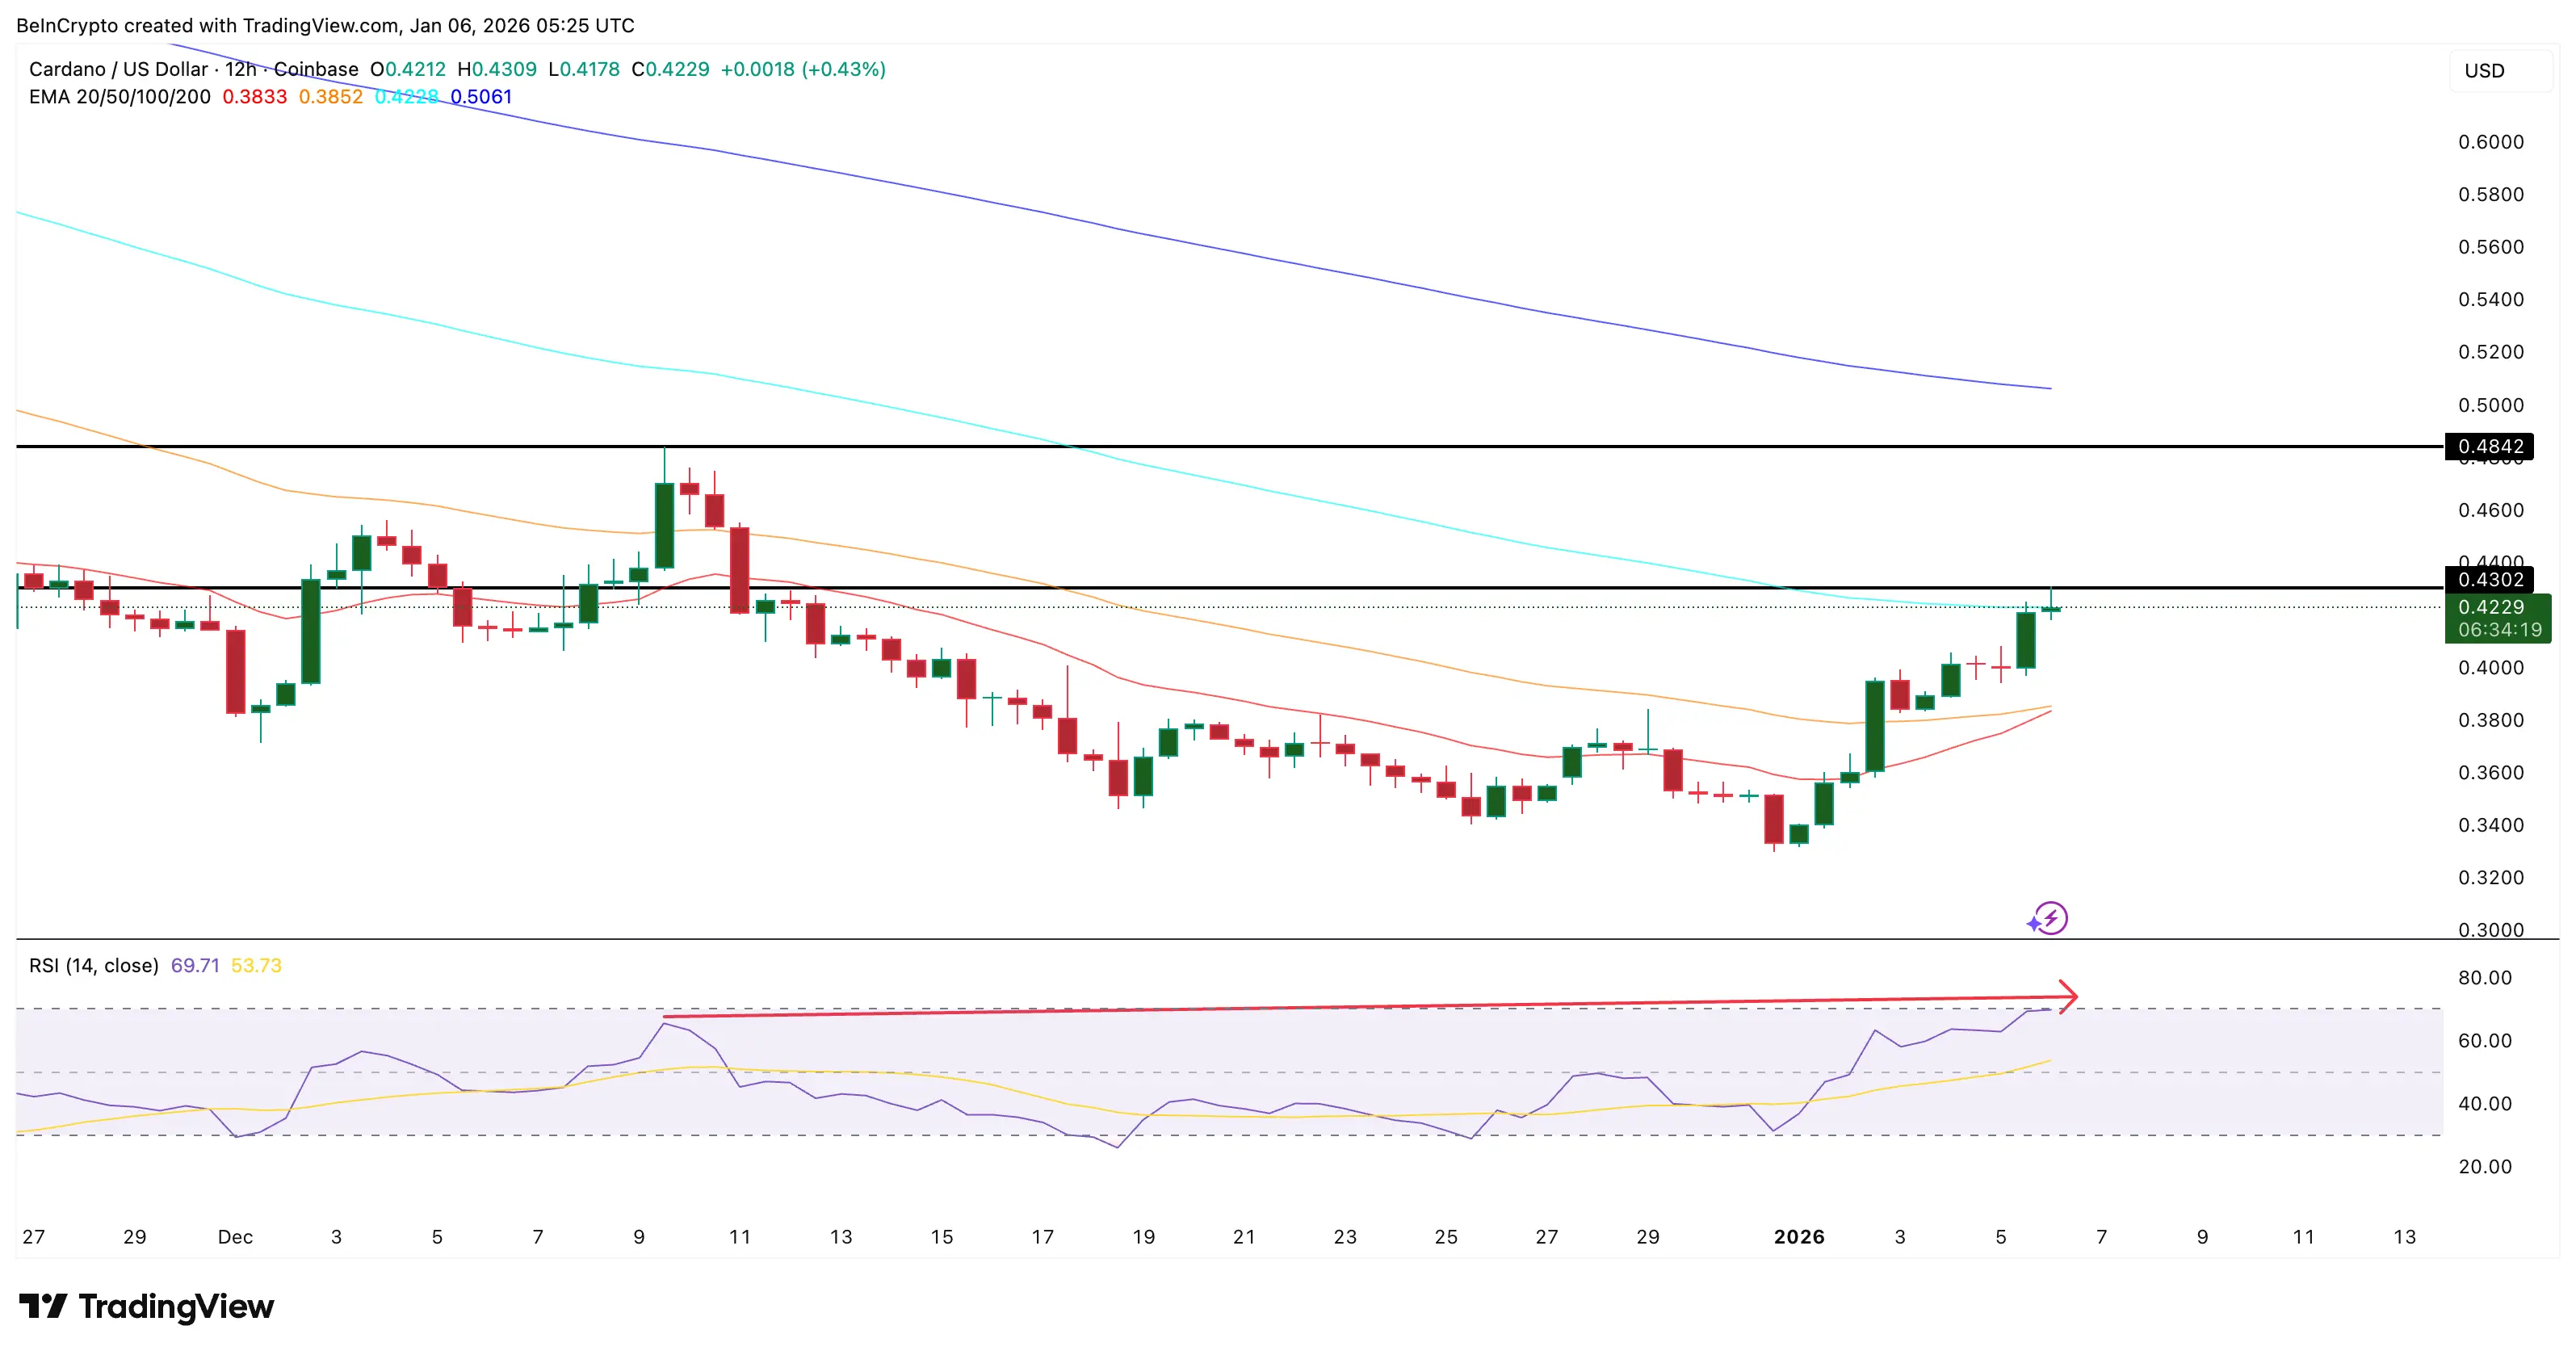 Conflicting indicators appear | Source: TradingView If the next candle of ADA forms below the $0.43 level, a lower high pattern will be confirmed, increasing the risk of correction.
In summary, the uptrend still exists, but the driving force has weakened. This combination often leads to an accumulation phase, moving sideways rather than continuing a strong rise or a sharp decline.
On-chain data: Patient investors, no signs of panic
On-chain indicators suggest the likelihood of a deep correction is quite low at this time.
The Spent Coins Age Bands index tracks the amount of ADA moved by investor groups with different holding periods. When this value decreases, it indicates that investors are holding onto their coins rather than selling.
The two most prominent groups are:
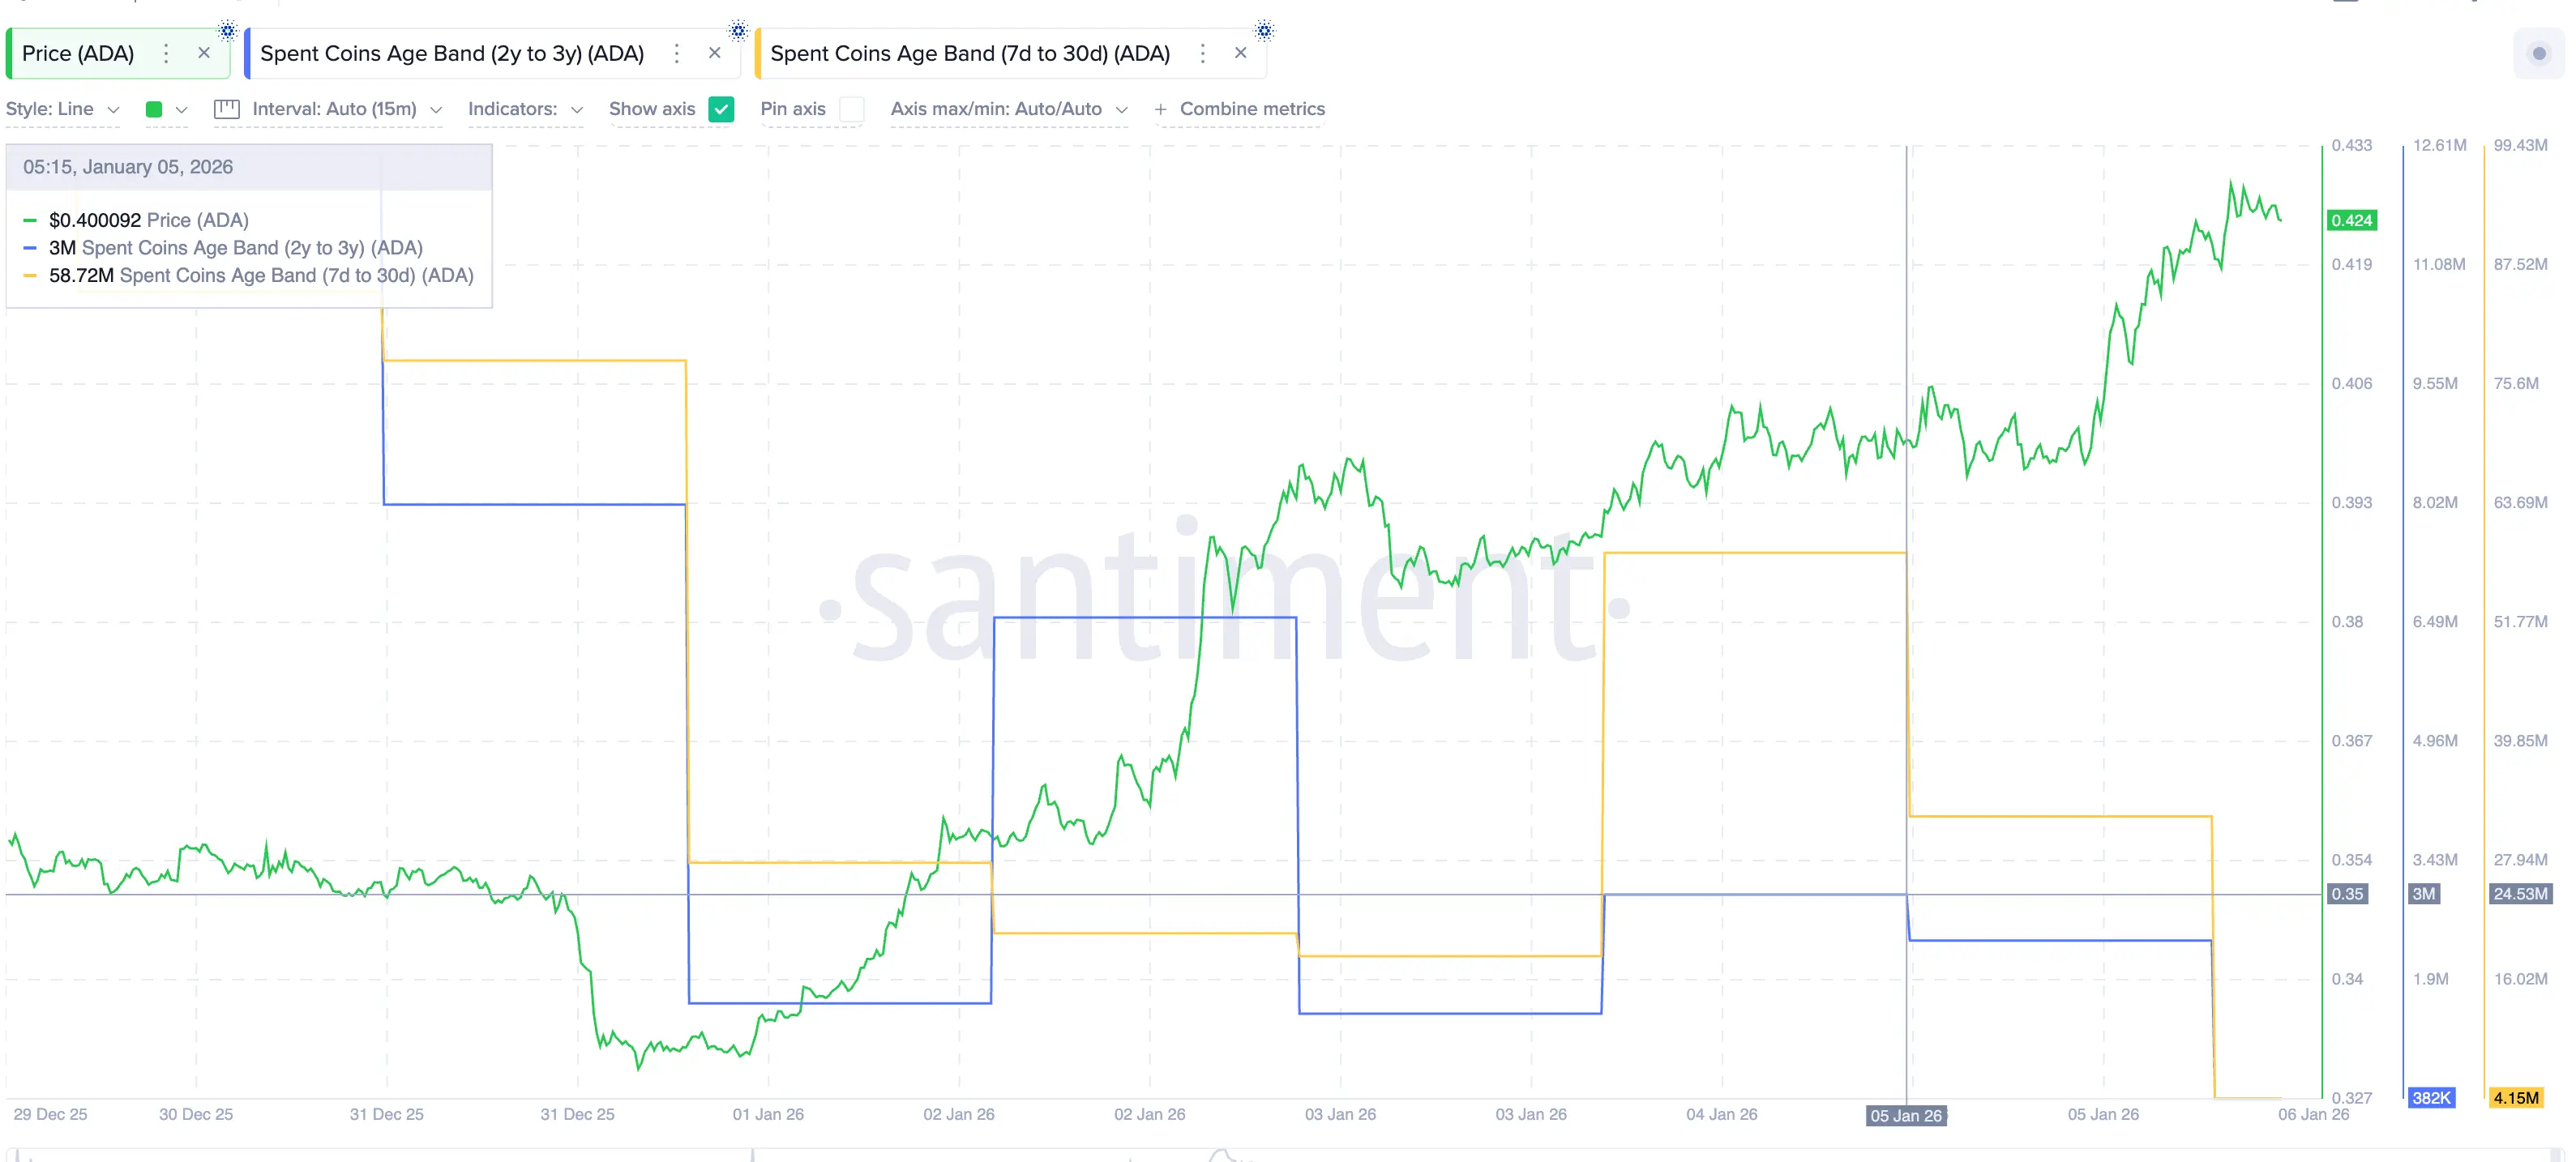 Slow transaction activity of ADA coins | Source: Santiment This shows that both short-term and long-term investors are choosing patience, with no signs of panic selling or strong profit-taking, even after the recent impressive rally.
When market momentum decreases but capital flow remains low, the market typically shifts into an accumulation state, trading within a narrow range rather than experiencing sharp declines.
Important ADA price levels: Trading range of 9%
In the context of weakening trend strength and momentum, price levels become particularly significant.
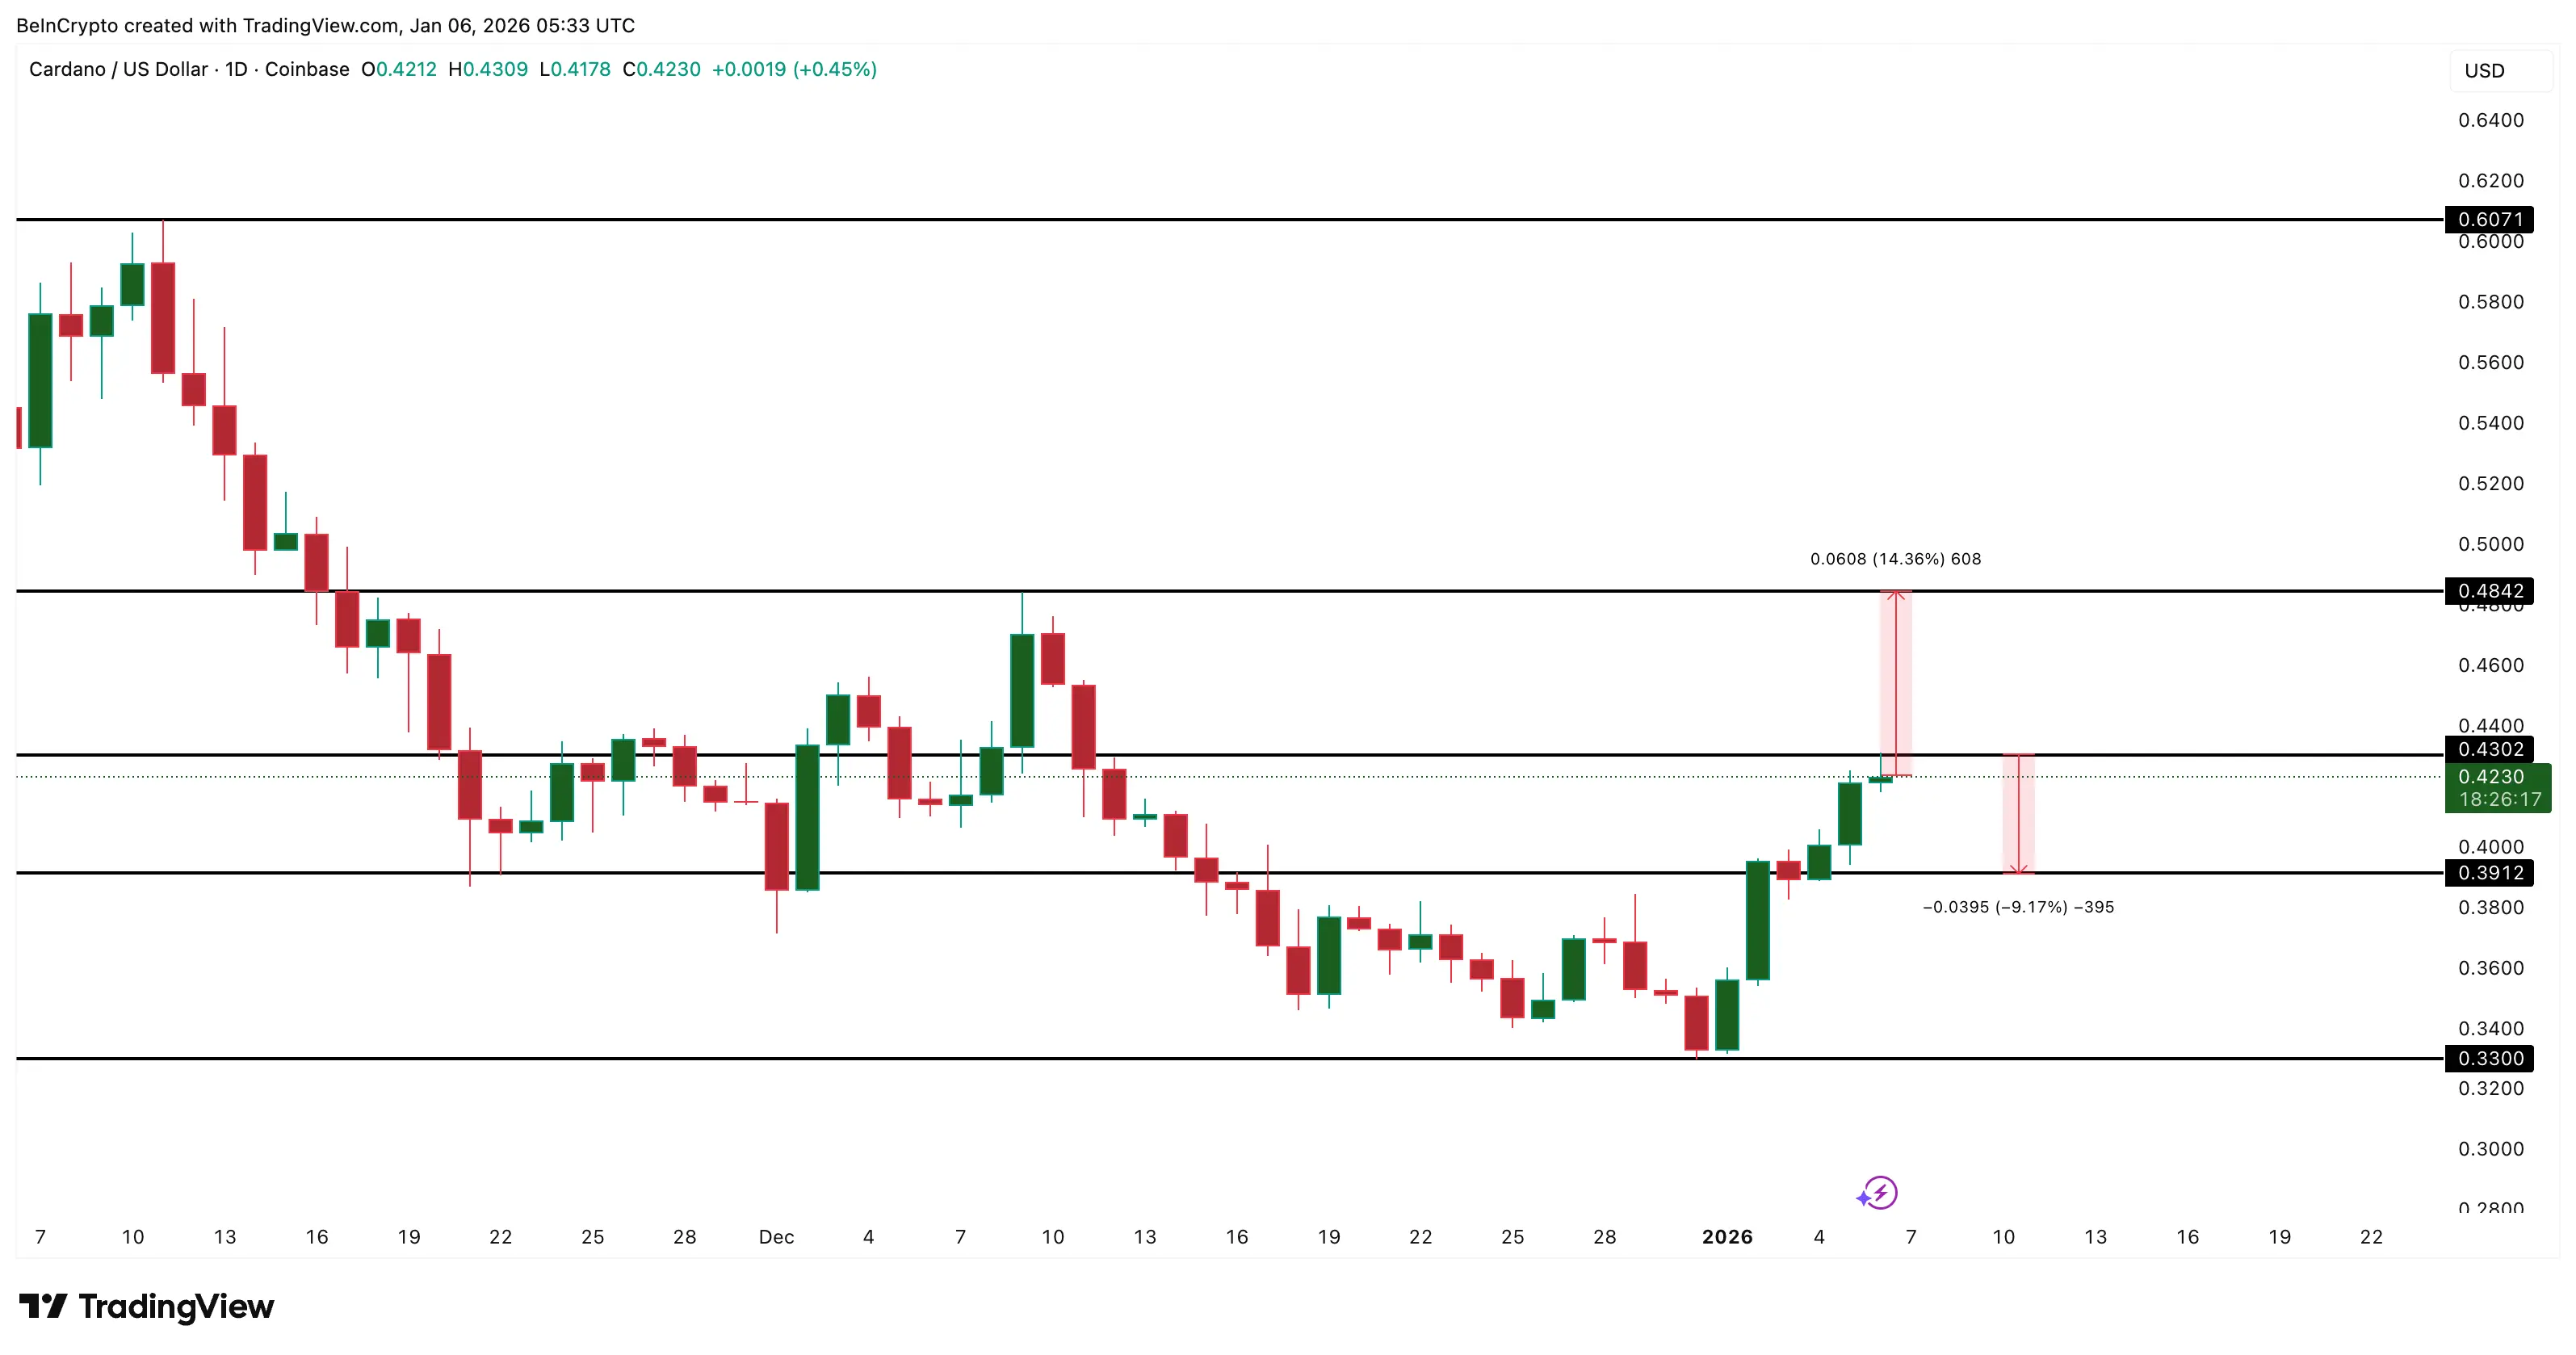 ADA price analysis | Source: TradingView Until one of these levels is broken, the most likely scenario is that ADA will trade within the range of $0.39 to $0.43, corresponding to about a 9% fluctuation.
This range accurately reflects the current market dynamics: the uptrend still exists, patient investors have not sold, but momentum needs time to reset before the next major move.
Disclaimer: The information on this page may come from third parties and does not represent the views or opinions of Gate. The content displayed on this page is for reference only and does not constitute any financial, investment, or legal advice. Gate does not guarantee the accuracy or completeness of the information and shall not be liable for any losses arising from the use of this information. Virtual asset investments carry high risks and are subject to significant price volatility. You may lose all of your invested principal. Please fully understand the relevant risks and make prudent decisions based on your own financial situation and risk tolerance. For details, please refer to
Disclaimer.
Related Articles
Aster Price Nears $0.79 Breakout as Reversal Pattern Strengthens
Key Insights
Aster price structure shows an inverse head and shoulders pattern forming beneath $0.79 resistance, signaling growing buying pressure and possible trend reversal ahead.
Repeated tests of the $0.79 neckline suggest weakening selling pressure as buyers steadily absorb supply
CryptoFrontNews2h ago
The HYPE price could surge despite the upcoming $2.8 million short squeeze.
The recent price movements of Hyperliquid (HYPE) are characterized by stagnation around 30 USD. A symmetrical triangle pattern indicates potential for a breakout in either direction, but market sentiment is cautious. Short squeeze risks may boost prices, while weak market flow and deteriorating demand pose challenges. The token could face significant support levels if it dips below 30 USD. An improved market sentiment could lead to a breakout above 33 USD, sparking recovery momentum.
TapChiBitcoin2h ago
Ethereum Price Holds Key Support: Is $2,200 the Next Test for ETH?
March 6, 2026 7:15 pm EST
TheCoinRepublic4h ago
Cardano Price Trends: Bulls Eye Opportunity as Indicator Flashes Green
ADA: Trading near $0.27, facing resistance at $0.28 and support at $0.26.
Technical Indicators: RSI and MACD show weak momentum, signaling short-term consolidation and cautious trading.
Macro Outlook: Rising PMI and historical patterns suggest potential bullish rebound if resistance
CryptoNewsLand5h ago
CryptoQuant: Bitcoin NUPL--MVRV indicator reaches 0.33, or has entered the mid-stage of a bear market
Gate News Announcement, March 7th, CryptoQuant analyst Axel pointed out on the X platform that the Bitcoin NUPL--MVRV harmonic composite indicator has reached 0.33, while historical cycle bottoms typically occur around the 0.5 range. The chart shows that the bear market cycle is beginning to shift upward, indicating that Bitcoin may have entered the mid-stage of this bear market cycle, suggesting that extreme selling conditions are easing. However, this indicator is still well above historical bottom levels, implying that a market-wide bottom has not yet been confirmed.
GateNews5h ago
ZEC Price Analysis: Upcoming Trends and Targets for the Next Few Weeks
ZEC: Stabilized near $200 support, rebounding toward $250 resistance after prolonged bearish pressure.
Technical Indicators: RSI and MACD show gradual improvement, signaling moderate bullish momentum returning.
Market Outlook: Sustained above $240 could push ZEC toward $268, while
CryptoNewsLand6h ago