
Date: Fri, Jan 02, 2026 | 09:15 AM GMT
The broader cryptocurrency market has started the new year on a stable footing, with both Bitcoin (BTC) and Ethereum (ETH) trading slightly higher and posting gains of over 1.5%. This modest strength across major assets has provided breathing room for risk-on sentiment, allowing several memecoins to show early signs of recovery — including Popcat (SOL) (POPCAT).
POPCAT is currently trading by solid 19% higher on the day, but the more important development lies in its broader technical structure. After months of consistent downside pressure, the price action is now beginning to hint at a potential trend reversal, supported by a well-defined bullish pattern forming on the daily chart.
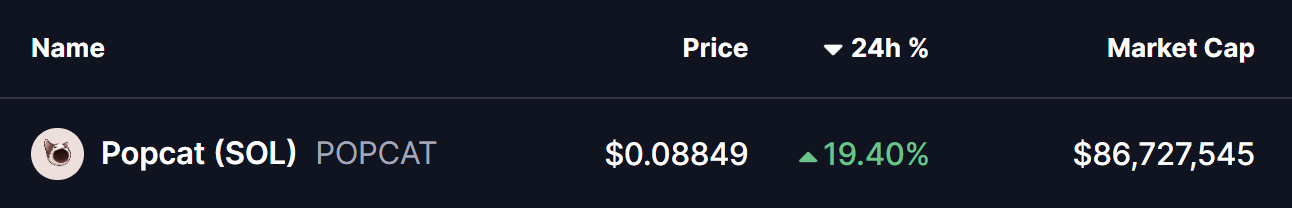
Source: Coinmarketcap
Falling Wedge Pattern in Play
On the daily timeframe, POPCAT appears to be carving out a falling wedge formation — a classic bullish reversal pattern that often develops after extended downtrends. This structure is characterized by lower highs and lower lows that gradually converge, reflecting weakening selling pressure and growing buyer interest near the lows.
Following weeks of steady decline, POPCAT recently established a local bottom near the $0.0725 region. This area acted as a strong demand zone, where buyers stepped in aggressively and prevented further downside. The resulting rebound pushed price back toward the $0.088 level, placing POPCAT just beneath the wedge’s upper resistance trendline.
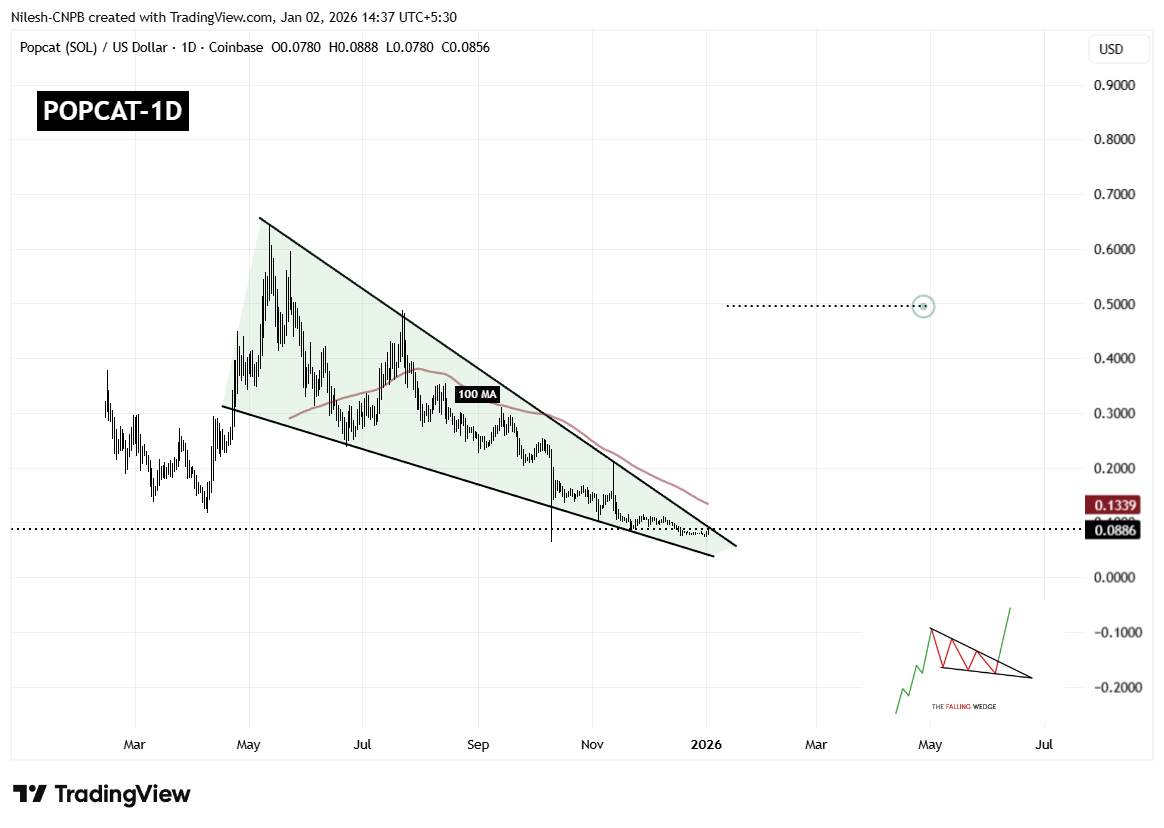
Popcat (POPCAT) Daily Chart/Coinsprobe (Source: Tradingview)
This compression near resistance is technically significant, as falling wedges tend to resolve with a sharp upside move once price breaks out of the structure. The longer price coils within the wedge, the stronger the eventual breakout tends to be.
However, overhead resistance remains notable. The 100-day moving average, currently hovering around $0.1339, represents a major technical barrier. This level has previously acted as dynamic resistance and will likely be a key area to watch if a breakout occurs.
What’s Next for POPCAT?
If buyers manage to push price decisively above the wedge resistance and reclaim the 100-day moving average with a strong daily close, POPCAT could confirm a bullish breakout. Such a move would mark a clear shift in trend structure and could open the door for a larger recovery rally.
Based on the measured move of the falling wedge pattern, the upside projection points toward the $0.49 region. Reaching this level would represent a substantial recovery from current prices and could attract renewed interest from momentum traders and sidelined participants.
That said, failure to break above resistance could result in continued consolidation. In a bearish scenario, POPCAT may revisit the $0.072 support zone once again. As long as this level continues to hold, the broader falling wedge structure would remain intact, keeping the bullish reversal thesis alive.
Overall, POPCAT is approaching a technically critical juncture. With price tightly compressed, selling pressure fading, and buyers defending key support levels, the coming sessions could prove decisive in determining whether this memecoin is ready to stage its next meaningful move higher.
Disclaimer: The views and analysis presented in this article are for informational purposes only and reflect the author’s perspective, not financial advice. Technical patterns and indicators discussed are subject to market volatility and may or may not yield the anticipated results. Investors are advised to exercise caution, conduct independent research, and make decisions aligned with their individual risk tolerance.
About Author: Nilesh Hembade is the Founder and Lead Author of Coinsprobe, with over 5 years of experience in the cryptocurrency and blockchain industry. Since launching Coinsprobe in 2023, he has been providing daily, research-driven insights through in-depth market analysis, on-chain data, and technical research.
Disclaimer: The information on this page may come from third parties and does not represent the views or opinions of Gate. The content displayed on this page is for reference only and does not constitute any financial, investment, or legal advice. Gate does not guarantee the accuracy or completeness of the information and shall not be liable for any losses arising from the use of this information. Virtual asset investments carry high risks and are subject to significant price volatility. You may lose all of your invested principal. Please fully understand the relevant risks and make prudent decisions based on your own financial situation and risk tolerance. For details, please refer to
Disclaimer.
Related Articles
Bitcoin Gets Its Own ‘Fear Gauge’ as Cboe Announces BITVX Index
Cboe Global Markets is bringing Wall Street’s favorite volatility playbook to bitcoin, announcing plans to launch a new index designed to track the market’s expected price swings using options tied to the popular Ishares Bitcoin Trust ETF.
BITVX: Cboe Applies VIX Methodology to Bitcoin ETF
Coinpedia47m ago
Strategy’s Michael Saylor Reveals $1.28B Bitcoin Purchase, Holdings Reach 738,731 BTC
Michael Saylor, executive chairman of Strategy, posted a brief but blunt update that stopped scrolling feeds: “Strategy has acquired 17,994 BTC for ~$1.28 billion at ~$70,946 per Bitcoin. As of 3/8/2026, we hodl 738,731 $BTC acquired for ~$56.04 billion at ~$75,862 per Bitcoin.” The numbers speak fo
BlockChainReporter58m ago
ETH 15-minute increase of 1.96%: On-chain large fund inflows and technical breakthroughs jointly amplify the rally
2026-03-09 19:15 to 19:30 (UTC), ETH achieved a short-term return of 1.96%, with the price range between 2010.14 and 2050.5 USDT, and an amplitude of 2.01%. Trading volume during this period significantly increased, market attention rapidly grew, and price fluctuations drew high investor interest.
The main driver of this movement was multiple large transfers of over 10,000 ETH on the blockchain, primarily flowing to a major exchange, indicating institutional or large investor accumulation, with positive capital inflows. At 19:15, ETH suddenly
GateNews2h ago
BTC 15-minute increase of 1.42%: On-chain capital inflow and technical breakout points resonate to trigger buying interest
From 19:15 to 19:30 on March 9, 2026 (UTC), the BTC price experienced a 15-minute return of +1.42%, with trading ranges between 68,377.3 and 69,365.3 USDT, and a volatility of 1.44%. This fluctuation far exceeds the regular intraday volatility levels, with market attention significantly heightened, and short-term buying surges intensifying the volatility.
The main driver of this movement was net inflow of on-chain funds, triggered by large transfers from major holder accounts, along with buy orders breaking through key technical resistance levels.
GateNews2h ago
Dogecoin Tests $0.090 Support After 3.4% Drop as Traders Watch Key Price Range
Dogecoin is currently trading at $0.09061 which is a drop of 3.4 percent, and the price is close to the important level of $0.09011 support.
The chart indicates a series of tests of the support zone of $0.089-$0.090, and the closest resistance is represented by $0.09353.
A hold of
CryptoNewsLand2h ago
Cardano Sees 1.7B ADA Traded as Price Tests Key Support
Key Insights
Cardano recorded more than 1.7 billion ADA in trading volume within 24 hours as market sentiment weakened and traders reacted cautiously.
On-chain data shows roughly 230 million ADA sold during the past week, which intensified selling pressure and pushed prices lower.
Cardano
CryptoFrontNews2h ago