Algorand price (ALGO) remains sideways around the 0.136 USD level on Thursday, as it approaches a key support zone in the market. Maintaining this price level could open room for a subsequent recovery. Notably, investor sentiment is gradually improving, as reflected by on-chain metrics and derivatives markets indicating more positive expectations from traders. From a technical perspective, the overall picture still leans toward an uptrend, with bulls aiming to conquer the 0.150 USD level in the short term.
On-chain and derivatives data for Algorand show improved sentiment
According to data from DefiLlama, the total value locked (TVL) in Algorand has maintained a steady upward trend since mid-December, currently reaching approximately $54.7 million. This development indicates capital flows returning to the Algorand ecosystem, reflecting increasing user interest as they actively deposit and deploy assets on protocols built on the ALGO platform.
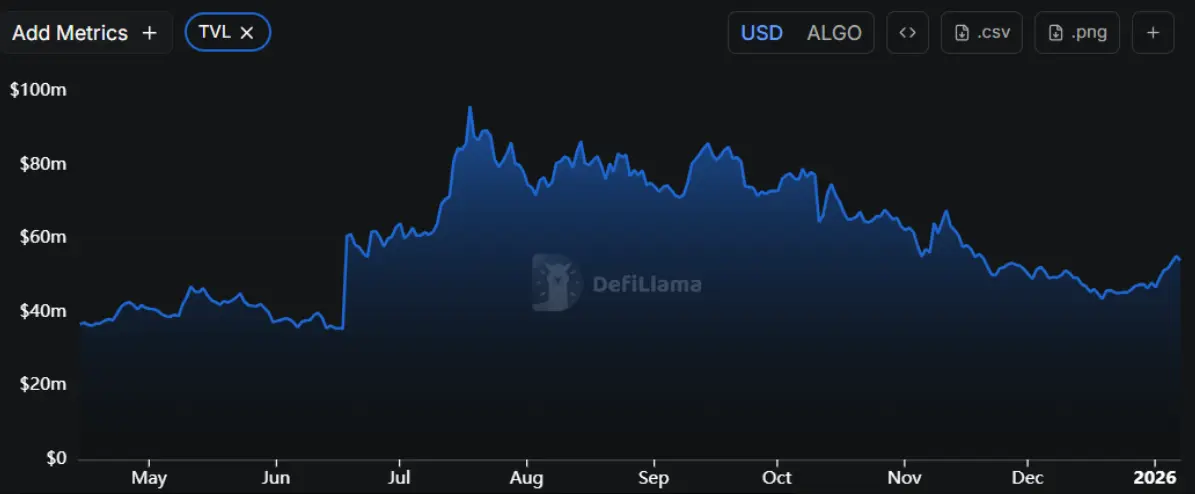 TVL chart of ALGO | Source: DefiLlama
Meanwhile, aggregated data from CryptoQuant continues to reinforce a positive outlook for the market. Both spot and futures markets for ALGO show large buy orders from whales, amid a clear bullish dominance. This signals that ALGO’s price could enter a new upward phase in the coming days.
TVL chart of ALGO | Source: DefiLlama
Meanwhile, aggregated data from CryptoQuant continues to reinforce a positive outlook for the market. Both spot and futures markets for ALGO show large buy orders from whales, amid a clear bullish dominance. This signals that ALGO’s price could enter a new upward phase in the coming days.
 Source: CryptoQuant
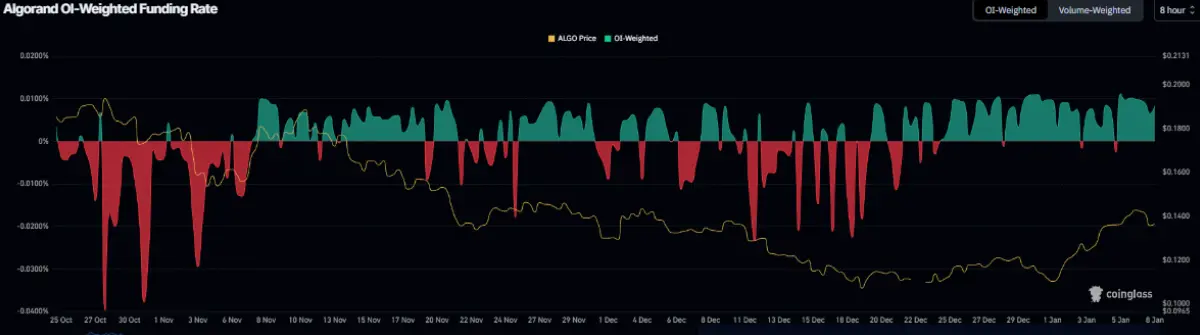
In the derivatives market, indicators also favor a bullish scenario. Algorand’s funding rate continues to trend positively, with OI-Weighted Funding Rate data from Coinglass showing that the number of traders betting on price increases exceeds those expecting declines. Notably, this index has turned positive since the beginning of the week and rose to 0.0084% on Thursday, indicating that longs are willing to pay fees to maintain their positions. Historically, instances where the funding rate shifts from negative to positive and continues to expand are often accompanied by significant price rallies for Algorand.
Source: CryptoQuant
In the derivatives market, indicators also favor a bullish scenario. Algorand’s funding rate continues to trend positively, with OI-Weighted Funding Rate data from Coinglass showing that the number of traders betting on price increases exceeds those expecting declines. Notably, this index has turned positive since the beginning of the week and rose to 0.0084% on Thursday, indicating that longs are willing to pay fees to maintain their positions. Historically, instances where the funding rate shifts from negative to positive and continues to expand are often accompanied by significant price rallies for Algorand.
 Algorand funding rate chart | Source: Coinglass
Algorand Price Forecast: ALGO could rise if key support holds
Algorand’s price broke out of the descending wedge pattern — formed by connecting highs and lows since early August — on Sunday, then increased nearly 5% over the next two sessions. However, the rally paused as ALGO experienced a slight correction midweek, and by Thursday, the price was oscillating around the recently broken trendline, indicating the market is testing this level again.
In a positive scenario, if the trendline — close to the 50-day exponential moving average (EMA) at 0.133 USD — continues to hold as support, ALGO is likely to regain upward momentum and target the daily resistance zone at 0.152 USD. Successfully closing above this level could open up more room for gains, with the next key resistance at 0.186 USD.
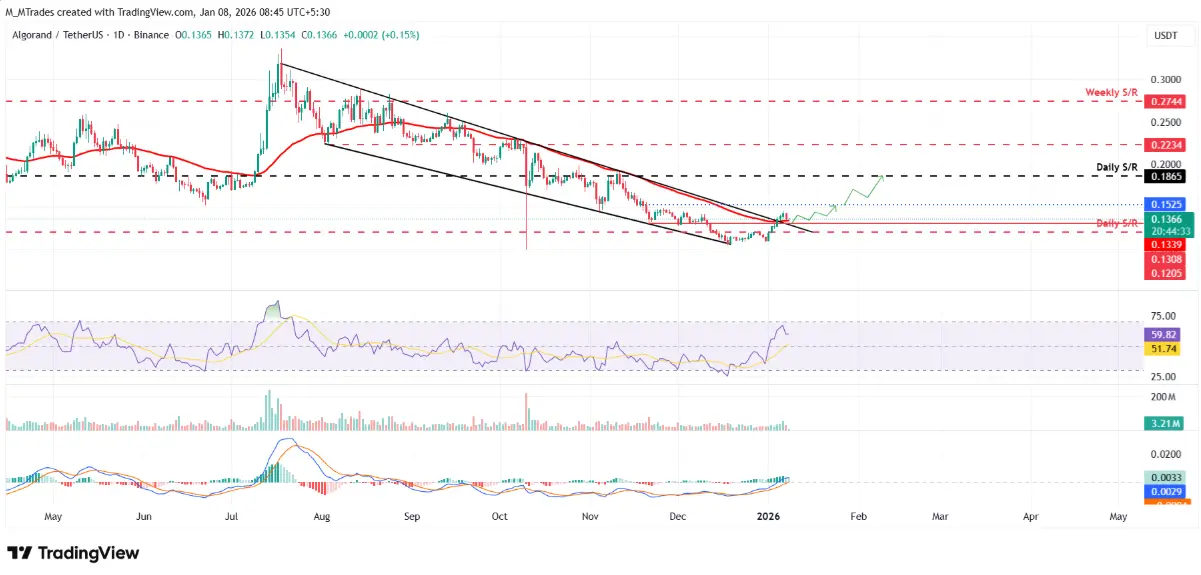 Daily ALGO/USDT chart | Source: TradingView
From a technical standpoint, the RSI indicator on the daily timeframe is at 59, above the neutral 50 level, reflecting increasing bullish momentum. Additionally, the MACD has shown a bullish crossover, while green histogram bars continue to expand above the neutral line, further supporting the bullish outlook.
Daily ALGO/USDT chart | Source: TradingView
From a technical standpoint, the RSI indicator on the daily timeframe is at 59, above the neutral 50 level, reflecting increasing bullish momentum. Additionally, the MACD has shown a bullish crossover, while green histogram bars continue to expand above the neutral line, further supporting the bullish outlook.
Conversely, if the trendline fails to hold as support, selling pressure could intensify, pushing ALGO’s price back toward the support zone around 0.120 USD.
SN_Nour
Disclaimer: The information on this page may come from third parties and does not represent the views or opinions of Gate. The content displayed on this page is for reference only and does not constitute any financial, investment, or legal advice. Gate does not guarantee the accuracy or completeness of the information and shall not be liable for any losses arising from the use of this information. Virtual asset investments carry high risks and are subject to significant price volatility. You may lose all of your invested principal. Please fully understand the relevant risks and make prudent decisions based on your own financial situation and risk tolerance. For details, please refer to
Disclaimer.
Related Articles
Polkadot to Reset Tokenomics on March 12 With Major DOT Supply and Staking Changes
Polkadot will introduce a new monetary framework on March 12 that sets DOT’s supply cap at 2.1 billion and lowers emissions by 53.6%.
The overhaul will also create a Dynamic Allocation Pool and shorten the DOT unbonding period from 28 days to 24–48 hours.
On March 12, Polkadot will reset
CryptoNewsFlash1h ago
Bitcoin May Be Closer to a Bottom Than Most Think, Chart Signals
The Bitcoin price slipped about 2% today, trading slightly below $68,000 after pushing above $73,000 earlier this week, as already covered on our site. The move added fresh pressure to a market that still feels shaky, especially after several failed attempts to hold higher levels.
Still, not e
CaptainAltcoin1h ago
Dogecoin Monthly Breakdown Pattern Reappears as Price Tests $0.0918
Dogecoin is currently trading at $0.09205 at a gain of 2.3, with support of above $0.08878.
As can be seen in the monthly chart, there are recurring breakdown areas that have been followed by significant expansions in price.
The short-term trading range is narrow and the immediate point o
CryptoNewsLand1h ago
Solana Eyes $90.6 Trigger Point as $83 Support Holds and Liquidation Pressure Builds
A large cluster of short positions faces liquidation if SOL reaches $90.6, potentially increasing volatility.
SOL trades between $83.00 support and $89.58 resistance, keeping price action compressed in the short term.
SOL posts a 0.8% daily gain and rises 0.7% against BTC, holding
CryptoNewsLand1h ago
Crypto Market Plunges As Extreme Fear Controls Investor Sentiment
The global crypto market is notably bearish, with a 2.93% drop in market capitalization to $2.32T. Bitcoin and Ethereum saw decreases of 3.07% and 4.01%, respectively. Meanwhile, notable gainers include $XBTC, $TRUMP, and $PEPE. DeFi TVL and NFT sales also declined significantly, while key investments from YZi Labs and Kazakhstan's central bank emerged.
BlockChainReporter2h ago
HBAR at a Crossroads: Will $0.095 Support Trigger a Break Toward $0.106?
HBAR is trading at $0.09739 and above the S/R flip of $0.094-$0.096 in the 12H chart.
The nearest resistance will be at $0.10 with a falling trendline pressure at around $0.104-$0.106.
The support is at $0.095835 and a breakdown at the
CryptoNewsLand2h ago