
**Date: **Tue, Jan 06, 2026 | 11:20 AM GMT
The broader cryptocurrency market continues to show renewed strength as 2026 gets underway. Bitcoin (BTC) is up around 6% on the week, while Ethereum (ETH) has posted gains of over 8%, helping improve overall sentiment across the market. This positive momentum is now spreading into major altcoins — including** Algorand (ALGO).**
ALGO has already delivered a strong 22% weekly gain, but the more important development is unfolding beneath the surface. Recent price action suggests a clear structural shift is taking place, one that could mark the early stages of a sustained bullish continuation if a critical resistance zone is decisively cleared.
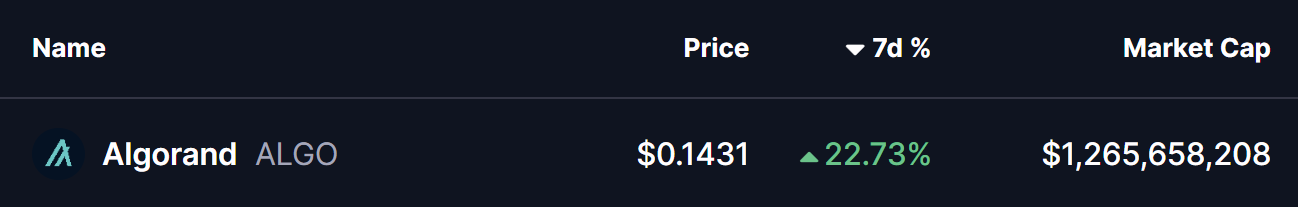
Source: Coinmarketcap
Right-Angled Descending Broadening Pattern in Play
On the 4-hour timeframe, ALGO had been trading inside a right-angled descending broadening formation — a bullish reversal structure defined by a flat overhead resistance and a rising lower boundary. For several weeks, price struggled to overcome the $0.1340–$0.1486 resistance band, with each rejection keeping ALGO locked in consolidation.
The recent rebound from the lower boundary of the structure marked a key turning point. Buyers stepped in aggressively, allowing ALGO to reclaim the 200-period moving average around $0.1225 — a level that had previously acted as dynamic resistance. This reclaim signaled improving momentum and a shift in short-term trend control.
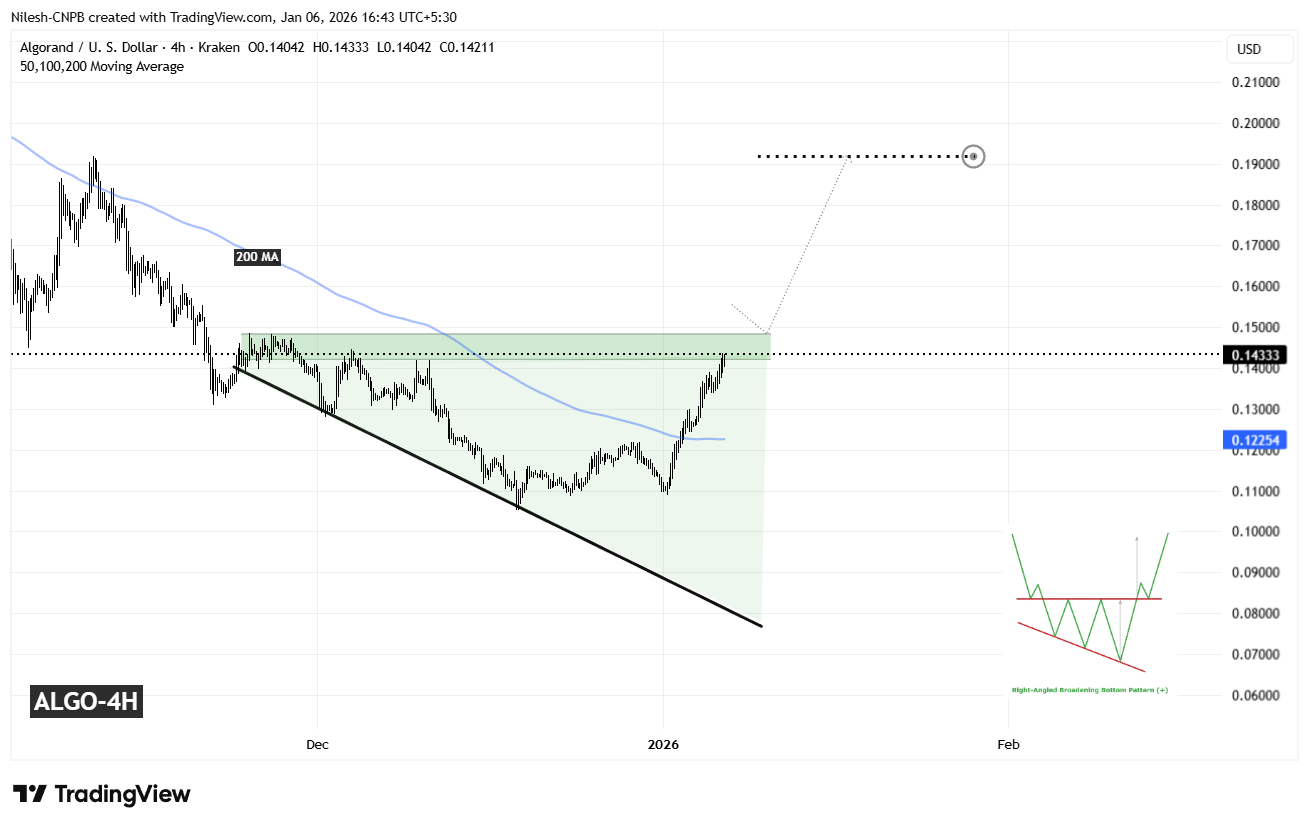
Algorand (ALGO) 4H Chart/Coinsprobe (Source: Tradingview)
Since then, ALGO has continued to push higher and is now pressing back into the same resistance zone that capped upside attempts in the past. This return to resistance places price at a critical inflection point where the broader trend direction could soon be decided.
What’s Next for ALGO?
A decisive close above the $0.1340–$0.1486 resistance zone would confirm a breakout from the descending broadening structure and validate the broader bullish reversal setup. Acceptance above this zone could attract fresh momentum participation and open the door to a stronger expansion phase.
Based on the depth of the formation and the projected measured move, the upside target points toward the $0.1920 region. Reaching that level would imply a potential upside of roughly 33% from current prices, aligning well with the typical behavior seen following successful breakouts from this pattern.
That said, patience remains important. Before any confirmed breakout, ALGO could still see short-term pullbacks — including a retest of the 200-period moving average, which has now turned into dynamic support. Such pullbacks would not invalidate the bullish setup as long as price continues to hold higher-low structures.
Until a clear breakout and follow-through occur, traders may want to remain cautious and avoid chasing price. The $0.1340–$0.1486 zone remains the key decision area that will determine whether Algorand transitions into a sustained bullish phase or continues consolidating as the new year unfolds.
Disclaimer: The views and analysis presented in this article are for informational purposes only and reflect the author’s perspective, not financial advice. Technical patterns and indicators discussed are subject to market volatility and may or may not yield the anticipated results. Investors are advised to exercise caution, conduct independent research, and make decisions aligned with their individual risk tolerance.
About Author: Nilesh Hembade is the Founder and Lead Author of Coinsprobe, with over 5 years of experience in the cryptocurrency and blockchain industry. Since launching Coinsprobe in 2023, he has been providing daily, research-driven insights through in-depth market analysis, on-chain data, and technical research.
Disclaimer: The information on this page may come from third parties and does not represent the views or opinions of Gate. The content displayed on this page is for reference only and does not constitute any financial, investment, or legal advice. Gate does not guarantee the accuracy or completeness of the information and shall not be liable for any losses arising from the use of this information. Virtual asset investments carry high risks and are subject to significant price volatility. You may lose all of your invested principal. Please fully understand the relevant risks and make prudent decisions based on your own financial situation and risk tolerance. For details, please refer to
Disclaimer.
Related Articles
'Black Swan' Author Nassim Taleb Believes Elon Musk's X Money is 'Much Smarter' Than Bitcoin - U.Today
Elon Musk's X Money will enter early access in April, with Nassim Taleb praising it as a superior alternative to Bitcoin. He argues it promotes competition in currency issuance, functional daily use, and is backed by a robust infrastructure, unlike volatile cryptocurrencies.
UToday6m ago
ETH 15-minute decline of 0.80%: On-chain large fund flows and DEX selling pressure resonate to trigger a downtrend
2026-03-11 15:00 to 2026-03-11 15:15 (UTC), ETH price briefly and rapidly declined within the range of 2042.35 to 2065.57 USDT, with a K-line return of -0.80% and an amplitude of 1.13%. Market volatility intensified during this period, with significantly increased attention, and short-term market pressure triggered market alertness.
The main driving force behind this anomaly is large-scale on-chain fund flows and sell pressure concentrated on decentralized exchanges (DEX). Monitoring data shows multiple large ETH transfers to trading platforms, suspected to involve institutions or whales.
GateNews26m ago
XRP Price Hints at Bullish Reversal as Negative Funding Rates Build Pressure on Short Sellers
XRP shows potential for a bullish reversal as market indicators align, with negative funding rates possibly triggering a short squeeze. Technical patterns and whale accumulation further support an upward move, indicating a significant price change may be imminent.
CryptometerIo54m ago
Shiba Inu (SHIB) regains momentum as buying pressure reaches the highest level of the month
The price of Shiba Inu (SHIB) is fluctuating around the 0.0000056 USD mark at the time of writing on Wednesday, after rising nearly 7% over the past two days. This recovery trend appears as on-chain indicators and derivatives market data begin to send positive signals. Trading volume is increasing.
TapChiBitcoin1h ago
Goldman Sachs: Hedge fund positioning may create conditions for a rebound in US stocks, with short positions rising to the highest since September 2022
Goldman Sachs report indicates that the structure of hedge fund positions in the US stock market is creating conditions for a market rebound. Speculators maintain long positions while shorting ETFs and futures. Short positions have reached their highest level since September 2022, reflecting market responses to uncertainty. If positive news emerges, it could trigger a rapid market rally.
GateNews1h ago
ETH 15-minute increase of 0.83%: Whales' capital inflow and DeFi lending demand resonate to drive the price
Between 13:30 and 13:45 (UTC) on March 11, 2026, ETH experienced a short-term fluctuation. The candlestick data shows a return of +0.83%, with a price range of 2046.07 to 2082.31 USDT, and an amplitude of 1.77%. Market activity increased during this period, with trading volume significantly higher than the previous cycle, and volatility exceeding the intraday average, attracting widespread market attention.
The main drivers of this fluctuation were the rapid inflow of large on-chain funds and active institutional accounts. Between 13:32 and 13:43,
GateNews1h ago