
**Date: **Sun, Jan 04, 2026 | 01:14 PM GMT
As 2026 gets underway, the broader cryptocurrency market is showing renewed stability. Ethereum (ETH) is up nearly 6% on the week, and several major altcoins are beginning to regain momentum. Against this improving backdrop, Hyperliquid (HYPE) is quietly positioning itself as a potential late mover, with its chart structure starting to flash early bullish signals.
While HYPE remains mostly flat on the weekly timeframe, the more important story is unfolding beneath the surface. Recent price action suggests a meaningful structural shift may be underway — one that could mark the early stages of a bullish continuation if key levels are reclaimed.
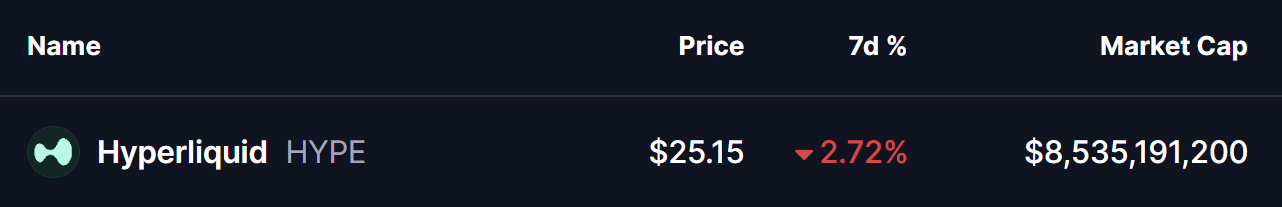
Source: Coinmarketcap
Rounding Bottom Pattern Taking Shape
On the daily timeframe, Hyperliquid appears to be forming a rounding bottom pattern, a classic bullish reversal structure that typically develops after a prolonged corrective phase. This pattern reflects a slow transition from aggressive selling to steady accumulation, as downside momentum fades and buyers gradually step back in.
The setup began after HYPE faced strong rejection near the $51.42–$50.06 neckline resistance zone, which triggered a sharp decline through late November and December. That downside move eventually found strong demand near the $22.20 support level, where selling pressure stalled. Multiple defenses of this area prevented further downside and helped establish a solid base for a potential trend reversal.
Since carving out that bottom, HYPE has started to curve higher in a smooth, rounded fashion — closely matching the textbook structure of a developing rounding bottom. The recent stabilization above the $25 region further supports the view that selling pressure is weakening and accumulation may be underway.
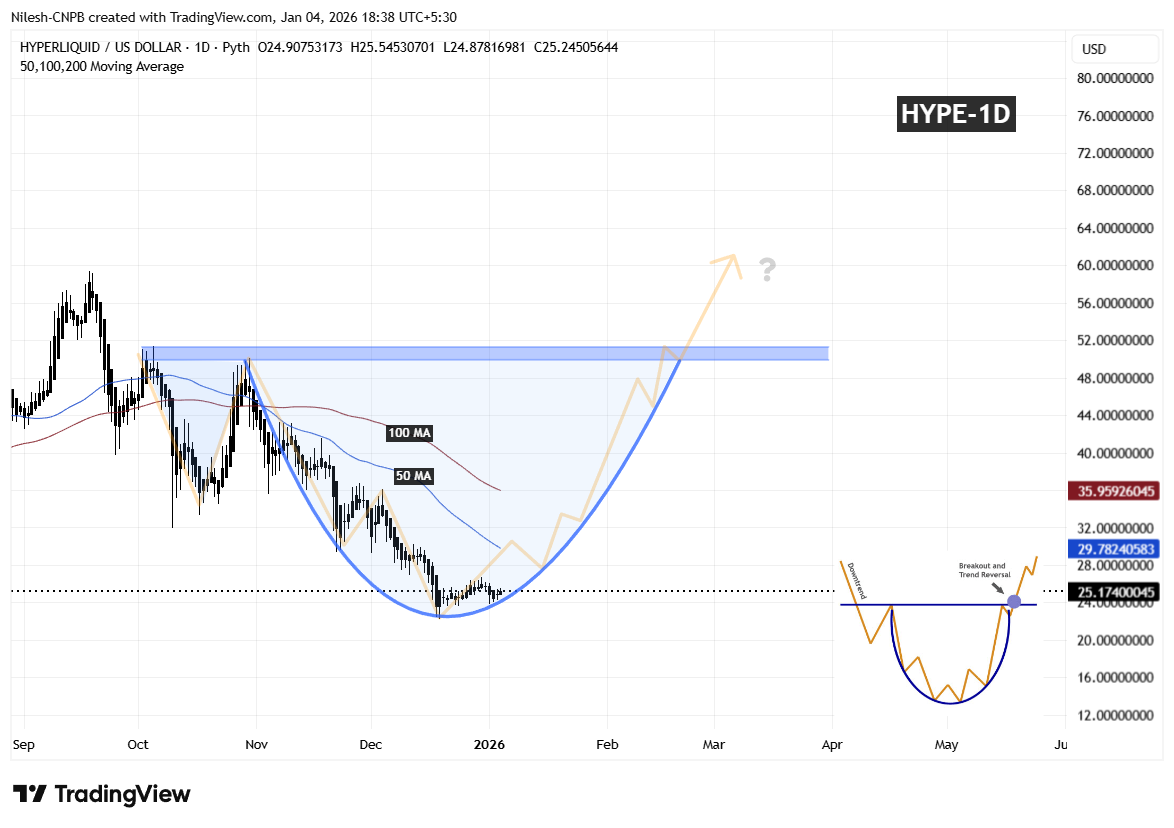
Hyperliquid (HYPE) Daily Chart/Coinsprobe (Source: Tradingview)
A key technical level now comes into play: the 50-day moving average, currently hovering near $29.78. This level has acted as dynamic resistance during the early recovery phase, and reclaiming it would mark an important shift in short-term market structure.
What’s Next for HYPE?
A sustained reclaim of the 50-day MA would be the first meaningful confirmation that buyers are regaining control after months of corrective price action. Holding above this level could allow price to build momentum toward the 100-day MA, which would further reinforce the developing reversal structure.
Looking ahead, the most important level remains the $51.42–$50.06 neckline resistance zone. A clean breakout above this area would validate the entire rounding bottom pattern and could open the door to a broader bullish expansion phase, with momentum traders likely re-entering the market.
In the near term, all eyes remain on the 50-day MA reclaim for upside confirmation. Until that happens, short-term consolidation or shallow pullbacks remain possible. However, as long as price continues to hold above the established base, the broader bottoming structure remains intact and constructive.
Disclaimer: The views and analysis presented in this article are for informational purposes only and reflect the author’s perspective, not financial advice. Technical patterns and indicators discussed are subject to market volatility and may or may not yield the anticipated results. Investors are advised to exercise caution, conduct independent research, and make decisions aligned with their individual risk tolerance.
About Author: Nilesh Hembade is the Founder and Lead Author of Coinsprobe, with over 5 years of experience in the cryptocurrency and blockchain industry. Since launching Coinsprobe in 2023, he has been providing daily, research-driven insights through in-depth market analysis, on-chain data, and technical research.
Disclaimer: The information on this page may come from third parties and does not represent the views or opinions of Gate. The content displayed on this page is for reference only and does not constitute any financial, investment, or legal advice. Gate does not guarantee the accuracy or completeness of the information and shall not be liable for any losses arising from the use of this information. Virtual asset investments carry high risks and are subject to significant price volatility. You may lose all of your invested principal. Please fully understand the relevant risks and make prudent decisions based on your own financial situation and risk tolerance. For details, please refer to
Disclaimer.
Related Articles
XRP Eyes $3 As Bollinger Band Squeezes, Setting Stage for Massive 217% Price Spike
In the volatile cryptocurrency landscape, the XRP coin is drawing investor interest for its ability to spur liquidity-driven moves. Today, market analyst Ali Martinez examined the latest chart trajectory of XRP and disclosed a Bollinger Band squeeze that suggests that the market is building for a
BlockChainReporter10m ago
PEPE Stalls at $0.053354 While Oscillators Drift Below 40 Inside Tight Trading Band
PEPE fell to 2.4 per cent to trade at a price of $0.053354 but above the level of support in the vicinity of $0.053325.
Momentum indicators are tight and oscillator values are close to 39.47 and 36.73 and MACD is close to zero line.
The intra-day range of $0.053325 to $0.053473 is still r
CryptoNewsLand36m ago
'Black Swan' Author Nassim Taleb Believes Elon Musk's X Money is 'Much Smarter' Than Bitcoin - U.Today
Elon Musk's X Money will enter early access in April, with Nassim Taleb praising it as a superior alternative to Bitcoin. He argues it promotes competition in currency issuance, functional daily use, and is backed by a robust infrastructure, unlike volatile cryptocurrencies.
UToday1h ago
ETH 15-minute decline of 0.80%: On-chain large fund flows and DEX selling pressure resonate to trigger a downtrend
2026-03-11 15:00 to 2026-03-11 15:15 (UTC), ETH price briefly and rapidly declined within the range of 2042.35 to 2065.57 USDT, with a K-line return of -0.80% and an amplitude of 1.13%. Market volatility intensified during this period, with significantly increased attention, and short-term market pressure triggered market alertness.
The main driving force behind this anomaly is large-scale on-chain fund flows and sell pressure concentrated on decentralized exchanges (DEX). Monitoring data shows multiple large ETH transfers to trading platforms, suspected to involve institutions or whales.
GateNews1h ago
XRP Price Hints at Bullish Reversal as Negative Funding Rates Build Pressure on Short Sellers
XRP shows potential for a bullish reversal as market indicators align, with negative funding rates possibly triggering a short squeeze. Technical patterns and whale accumulation further support an upward move, indicating a significant price change may be imminent.
CryptometerIo2h ago
Shiba Inu (SHIB) regains momentum as buying pressure reaches the highest level of the month
The price of Shiba Inu (SHIB) is fluctuating around the 0.0000056 USD mark at the time of writing on Wednesday, after rising nearly 7% over the past two days. This recovery trend appears as on-chain indicators and derivatives market data begin to send positive signals. Trading volume is increasing.
TapChiBitcoin3h ago