Canton Coin (CC) faces significant challenges at a critical moment. After unexpectedly returning to the accumulation zone of the bullish pattern, this token has adjusted nearly 16% over the past week and is currently about 22% below the recent all-time high set just a week ago. This development threatens to break the upward structure that many investors are paying attention to.
Although the overall outlook still offers strong growth potential if market conditions improve, the weakening trading volume and capital flow indicate that the breakout opportunity may close faster than expected.
Increasing pressure on the Cup-and-Handle pattern at a key support zone
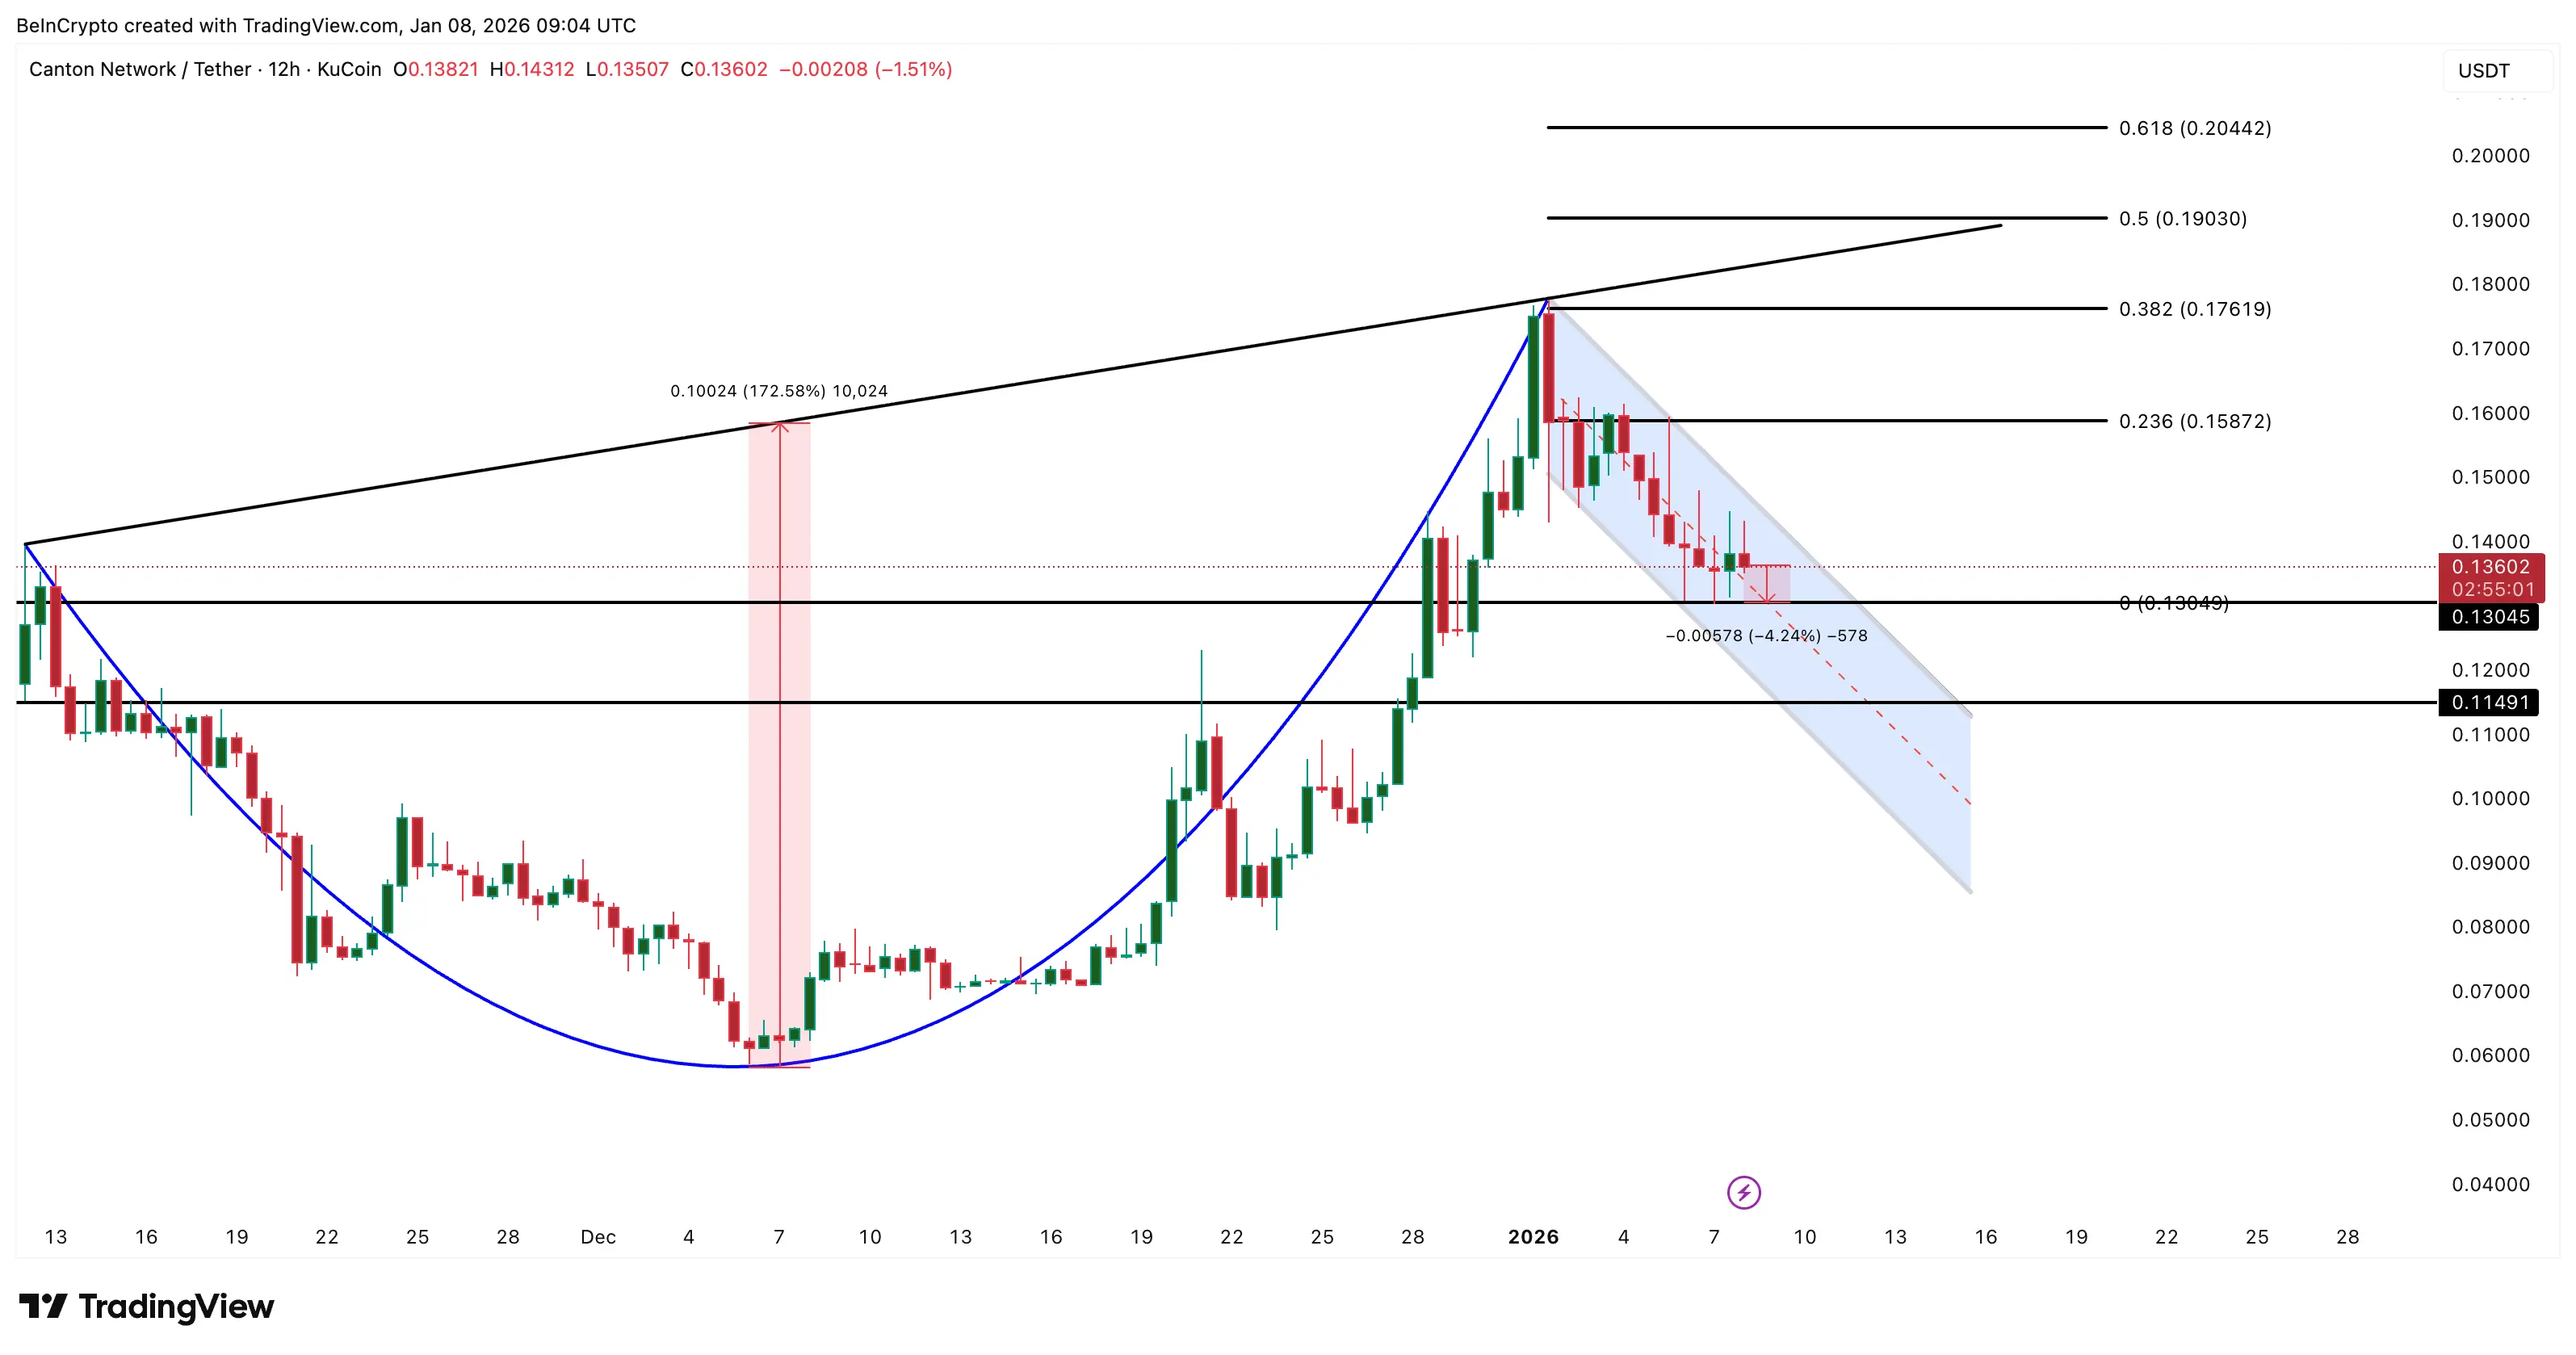
On the 12-hour chart, Canton Coin is forming a cup-and-handle pattern, which often signals upcoming strong growth phases. The “handle” phase is a period of price consolidation after a rally, preparing for a new breakout.
For Canton, the breakout prospects remain very attractive: if the price regains momentum and breaks above the neckline resistance, the growth target is projected to reach 172%. However, the current risk lies in the token’s trading position.
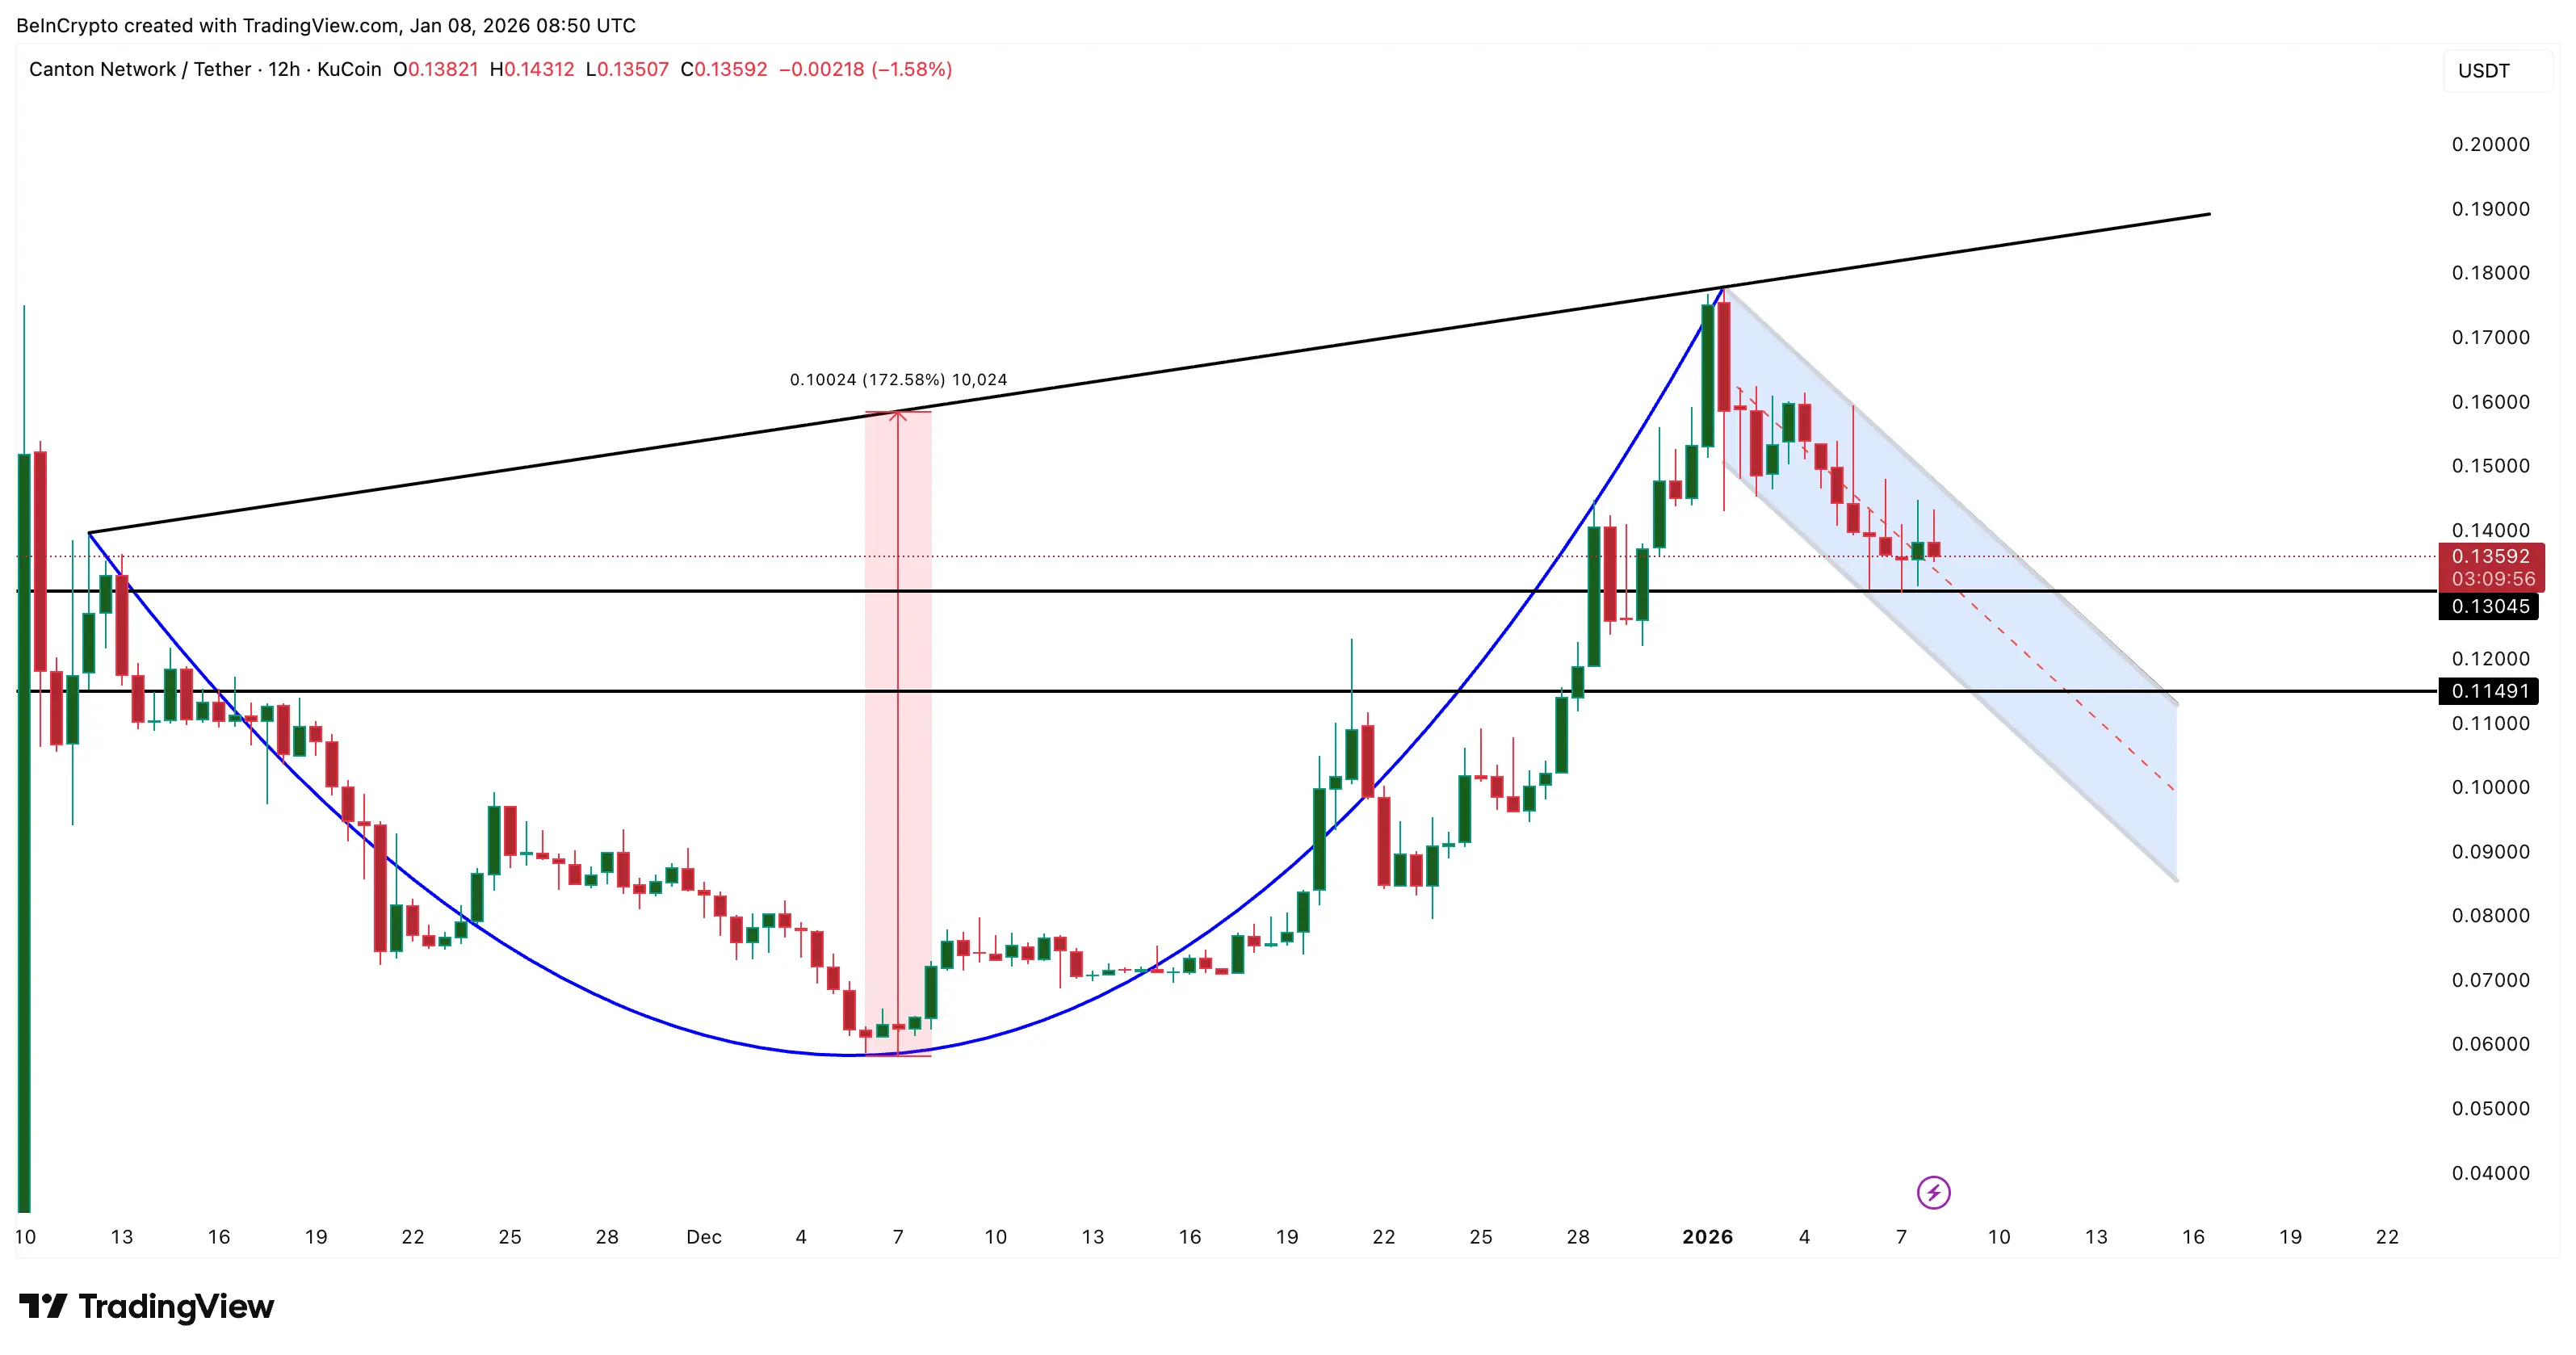 Bullish Pattern | Source: TradingView Canton is currently oscillating just above the handle support zone, making the risk of a price decline more apparent than the growth expectation. If the price closes consistently below $0.13 on the 12-hour timeframe, the bullish structure will weaken significantly.
This imbalance is noteworthy: the neckline is still far from the current price, while the stop-loss level is very close, making the pattern fragile in the short term.
Community enthusiasm sustains prices, temporarily preventing deep declines
One factor helping Canton Coin avoid stronger selling pressure is the increasing interest from the community. The social dominance index, which reflects the level of discussion about the token relative to the entire crypto market, has surged in recent days.
Since January 3rd, Canton’s social dominance has jumped from about 0.05% to nearly 0.56%, a tenfold increase in less than a week, despite the price still correcting. This spike is notable given last week’s relatively weak trading performance.
This correlation has historically played an important role: in mid-December, when social dominance peaked locally, Canton’s price increased by 57% within a few days. The second peak occurred near December 28th, when social dominance reached about 0.74% and the price traded around $0.12. This sudden attention led to a rally up to $0.17, Canton’s all-time high.
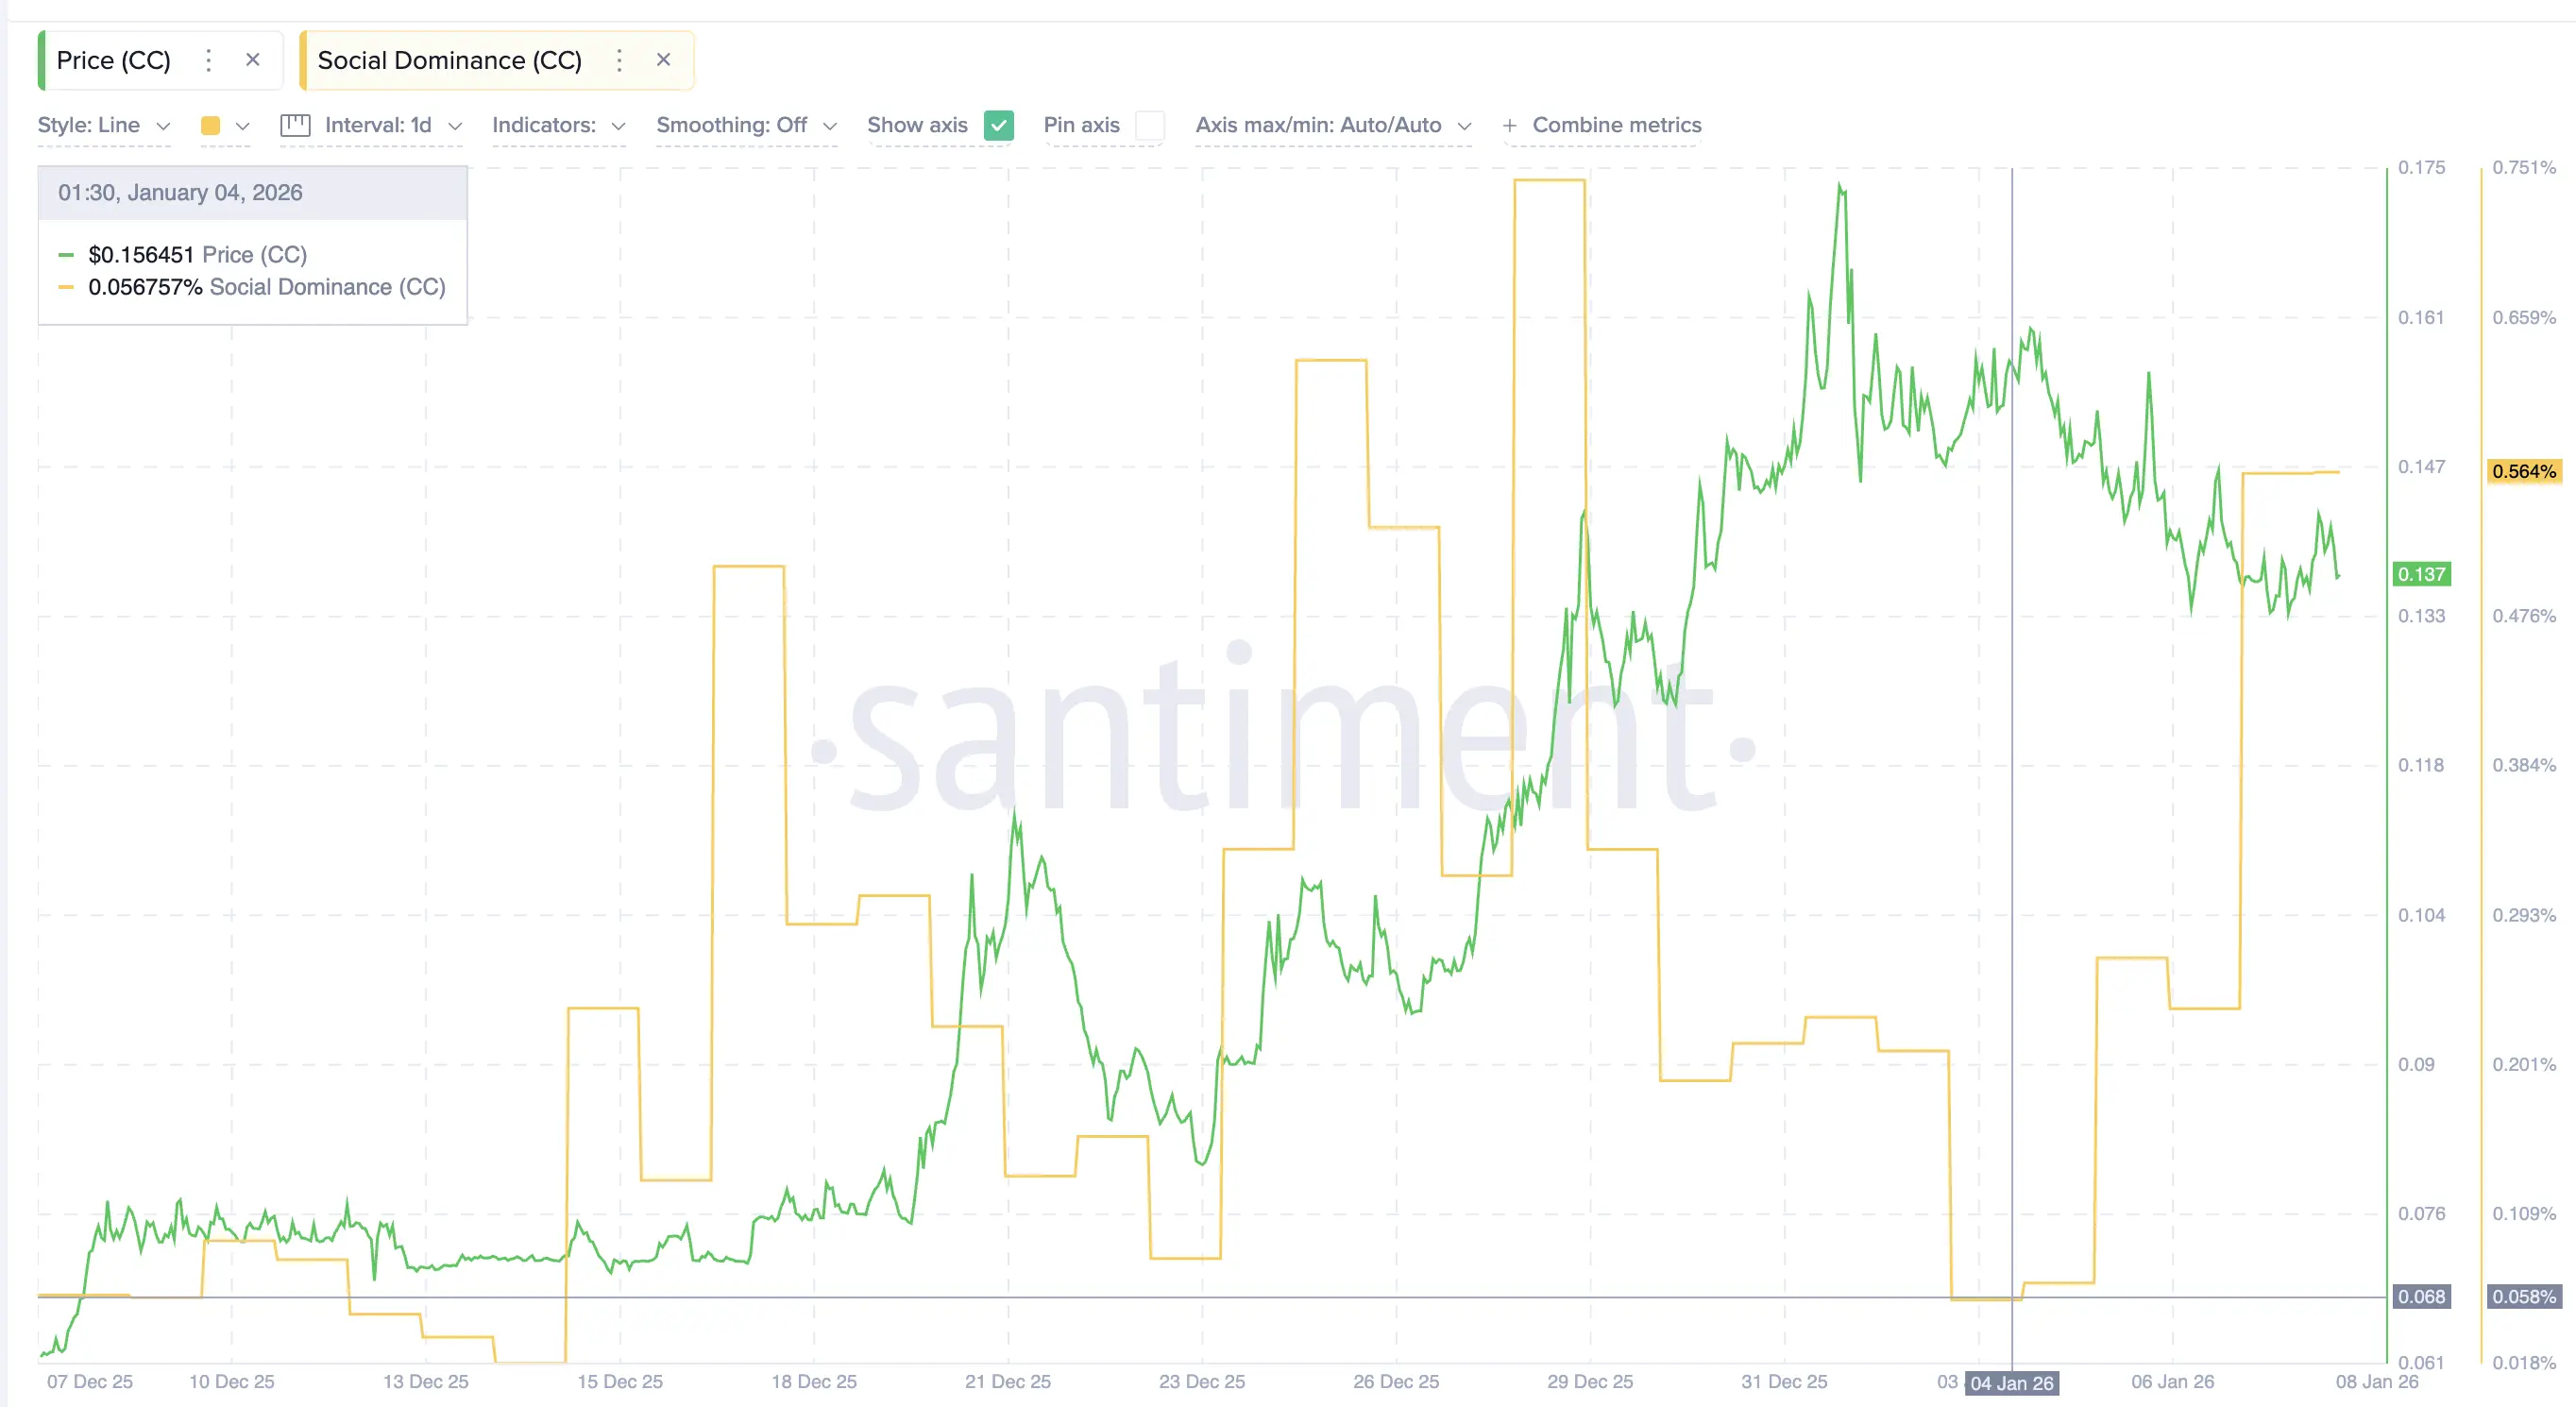 Active Social Media Discussion | Source: Santiment In Canton’s short trading history, sharp increases in social dominance often coincide with significant price expansions. This makes the current attention spike particularly important, potentially the main reason why CC’s price has not dropped sharply despite the overall market weakness.
However, community interest alone is not enough to sustain a sustainable upward trend.
Weak trading volume and capital flow diminish growth prospects
Despite growing community enthusiasm, actual participation levels are not commensurate. The accumulation volume indicator, OBV, which measures whether trading volume confirms the price direction, continues to decline on the 12-hour chart. Since mid-November, Canton’s price has been rising steadily, but OBV has moved in the opposite direction, with no signs of recovery yet.
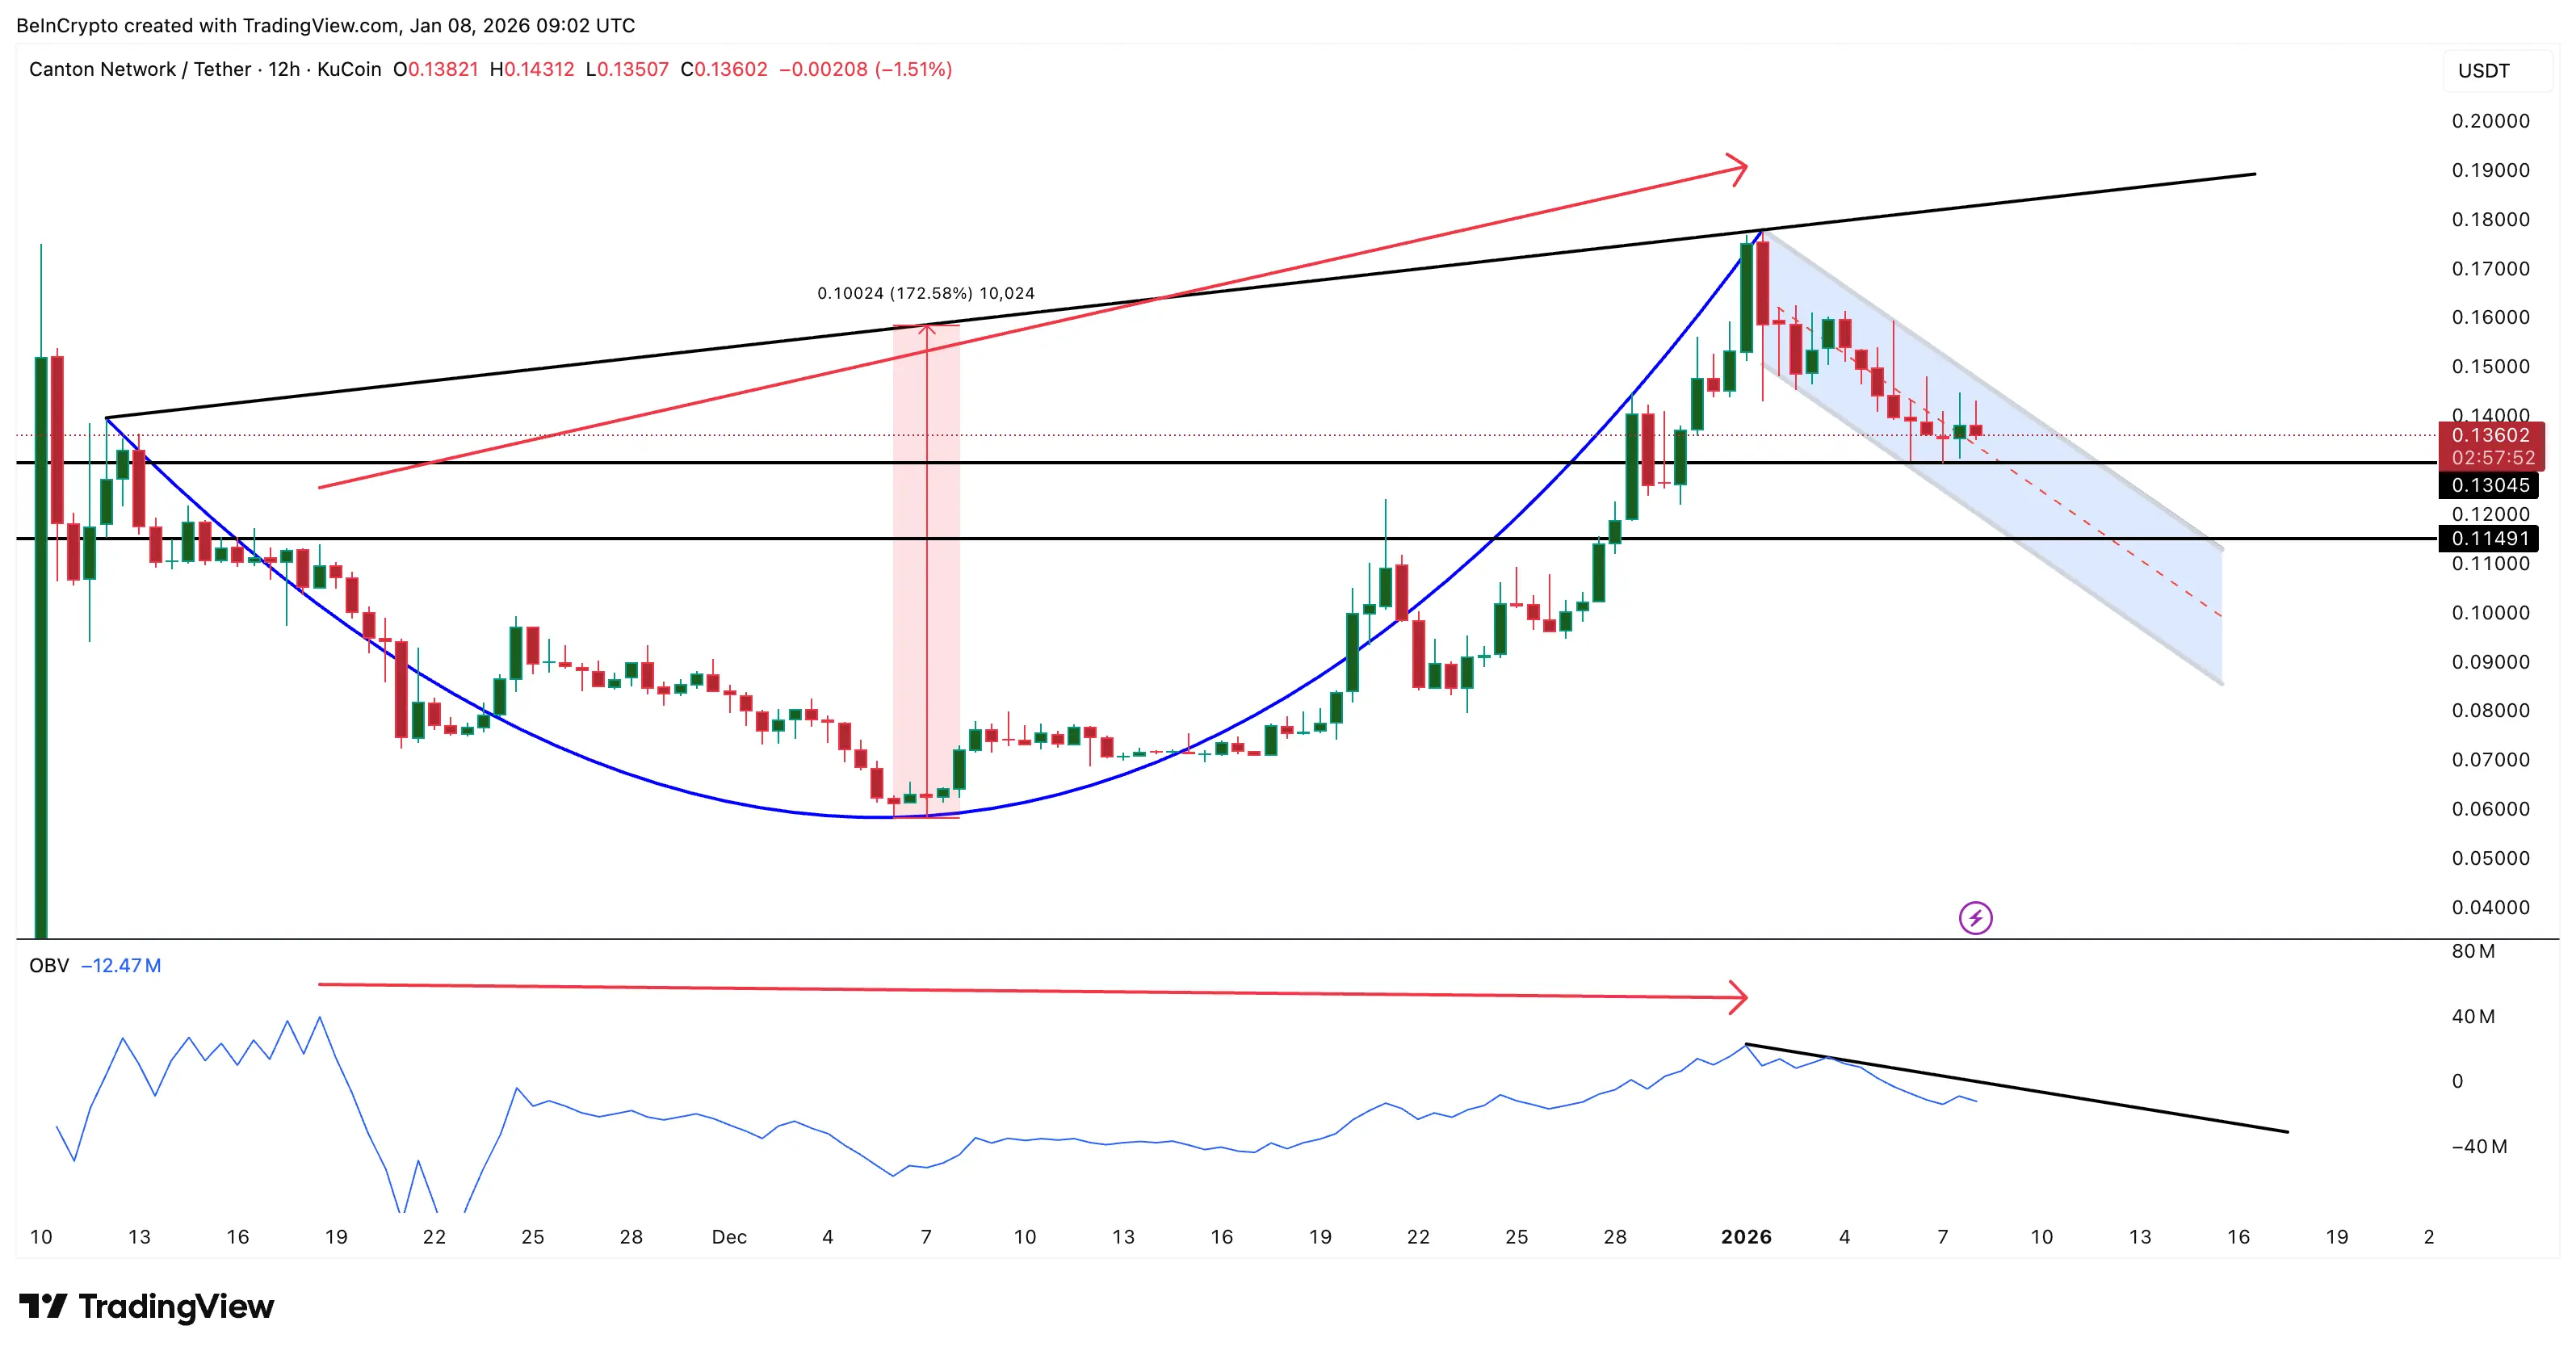 Significant Drop in Trading Volume Across the System | Source: TradingView This divergence indicates that recent price increases are mainly driven by thin trading volume rather than genuine demand expansion. This is a key reason why the current price struggles to break out, prolonging the accumulation phase.
Capital flow data also raises concerns. The Chaikin Money Flow index, CMF, which measures large capital inflows or outflows from an asset, fell below zero on January 5th, signaling net capital withdrawal from the token. Although the CMF temporarily stabilized after a slight rebound on January 7th, the indicator remains weak and at risk of further decline.
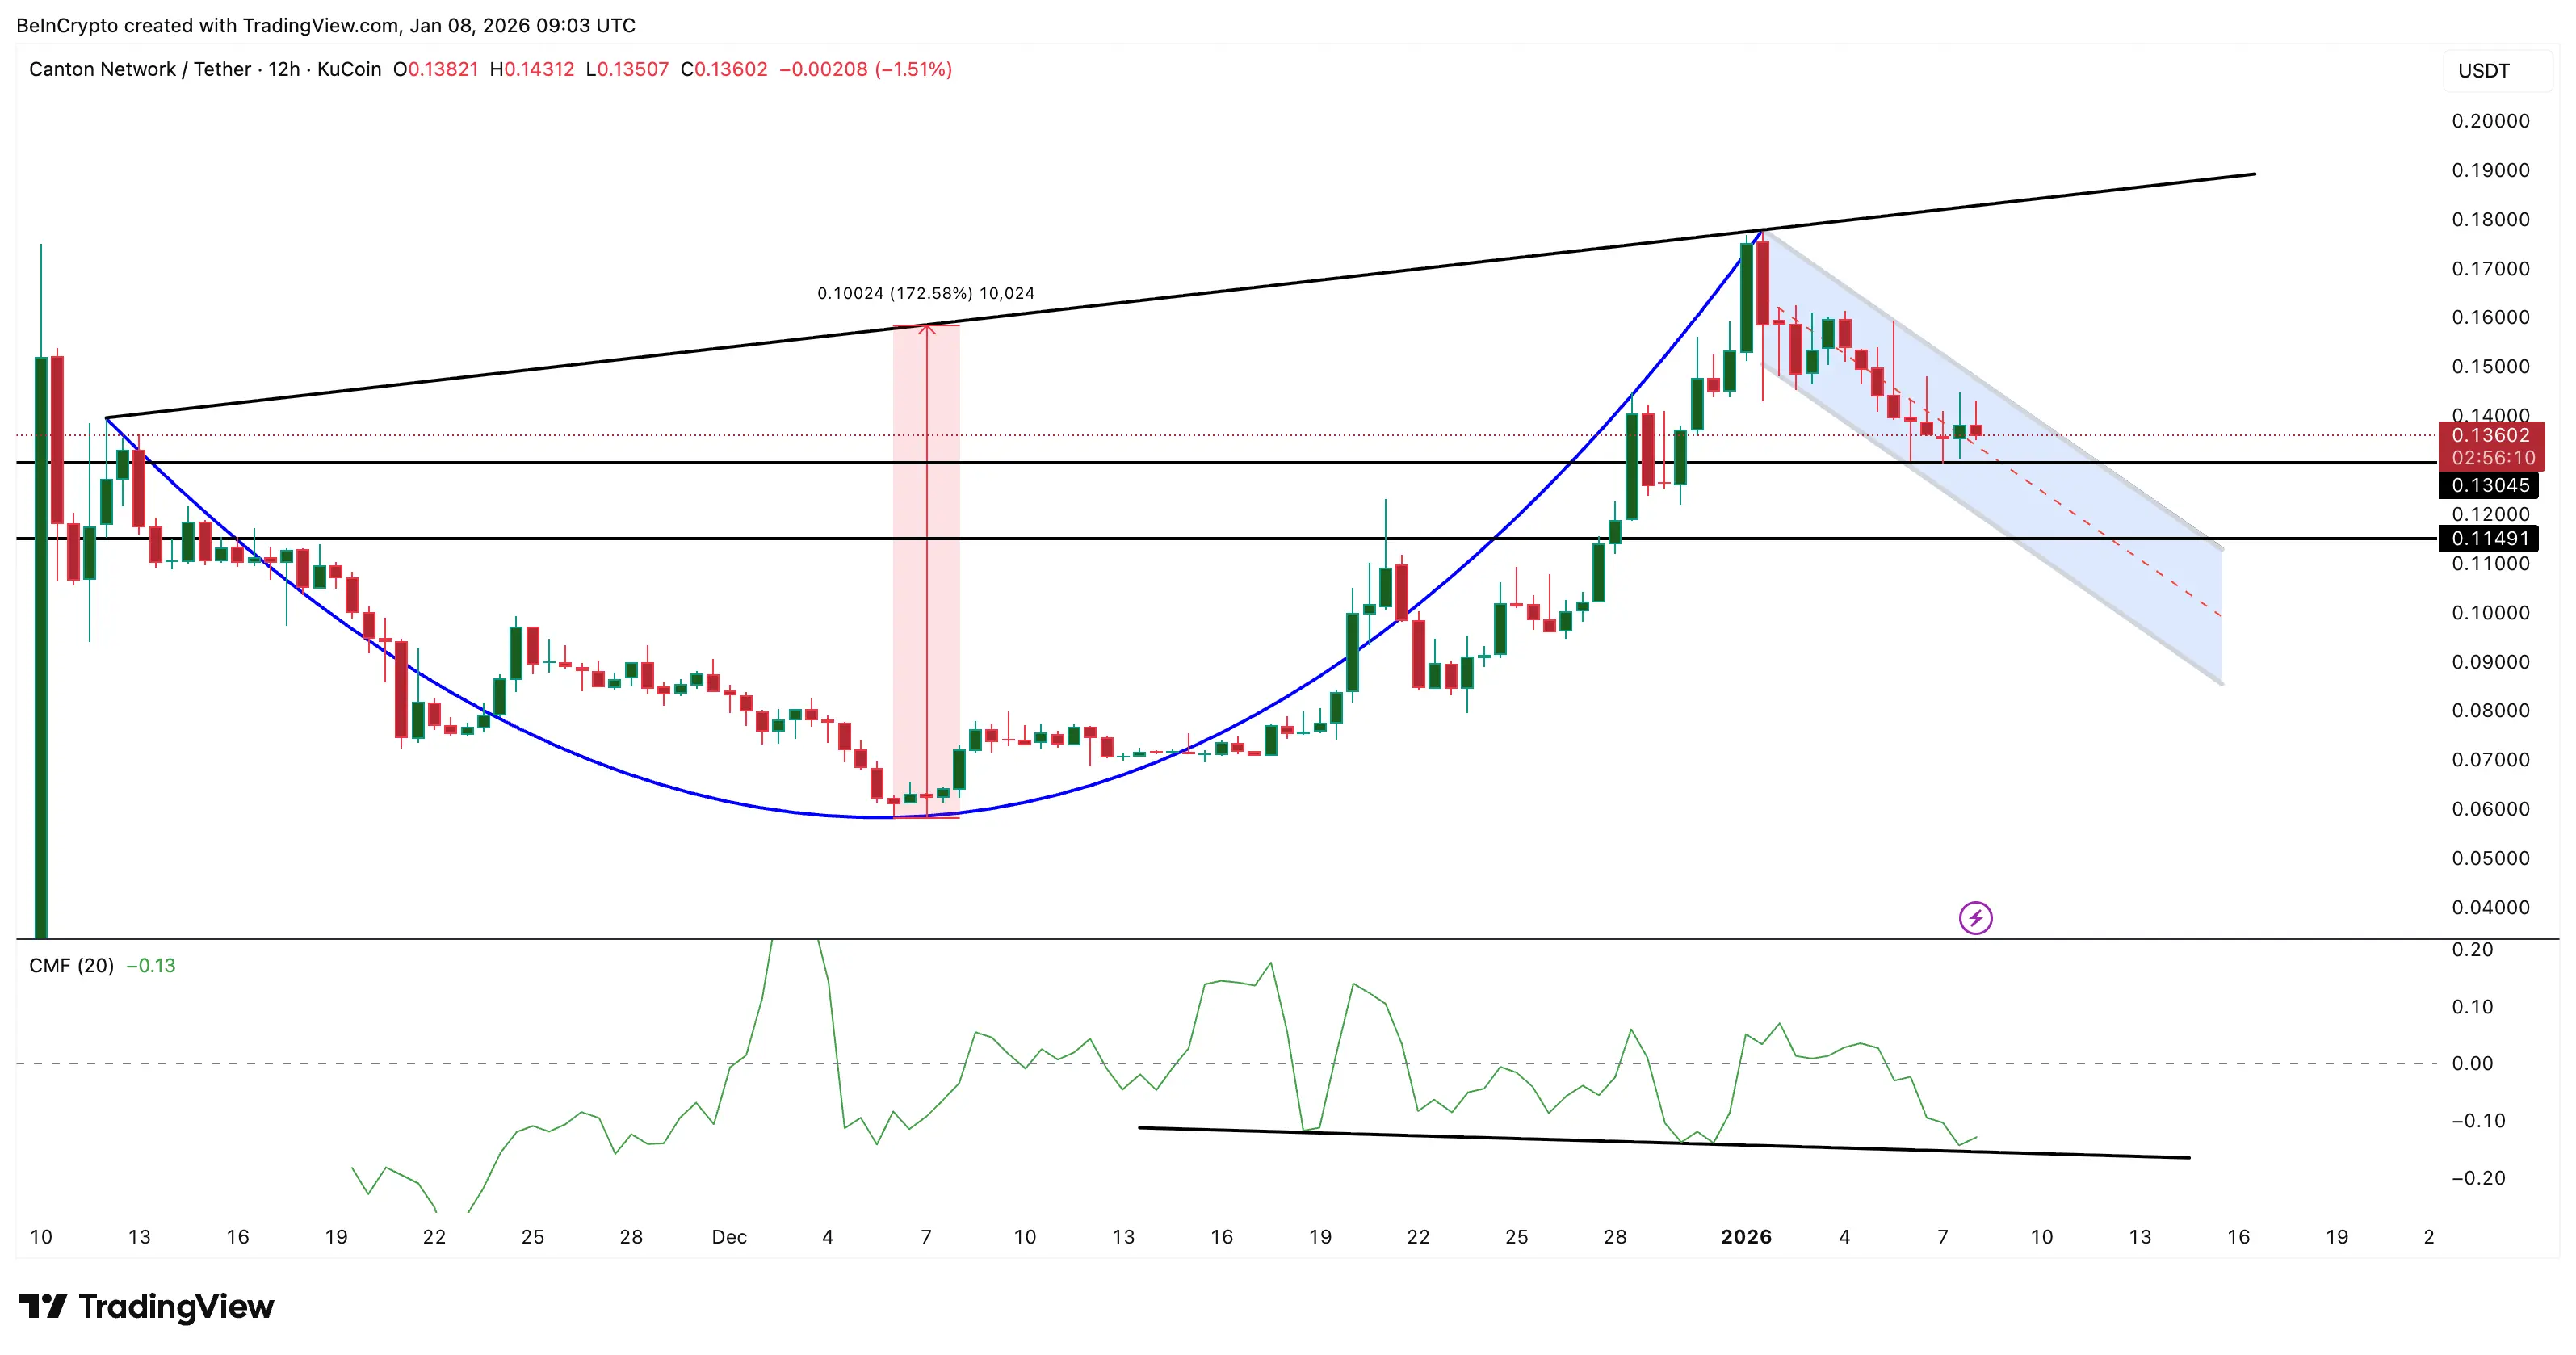 Large Investors Avoid Canton Coin | Source: TradingView When both OBV and CMF decline, it indicates that large investors have not yet committed new capital into Canton. Without this backing, bullish patterns often fail before they can fully breakout.
From a technical perspective, key price levels are very clear. Canton’s price needs to stay above $0.13 to maintain the upward trend. Surpassing the $0.15 level would be the first sign of renewed strength. To activate the 172% growth scenario, the price must sustainably break above $0.19.
 Price Analysis of Canton | Source: TradingView Conversely, if the price falls below $0.13 and continues down through $0.11 near the handle support zone, it will confirm a serious weakening of the bullish structure.
Currently, Canton Coin is mainly supported by community attention rather than actual trading volume or capital flow. This imbalance explains the tense state of the price. If buying pressure and capital inflows do not improve soon, the bullish pattern is likely to fail before realizing its full potential.
Disclaimer: The information on this page may come from third parties and does not represent the views or opinions of Gate. The content displayed on this page is for reference only and does not constitute any financial, investment, or legal advice. Gate does not guarantee the accuracy or completeness of the information and shall not be liable for any losses arising from the use of this information. Virtual asset investments carry high risks and are subject to significant price volatility. You may lose all of your invested principal. Please fully understand the relevant risks and make prudent decisions based on your own financial situation and risk tolerance. For details, please refer to
Disclaimer.
Related Articles
SIGN Spikes 61.3% As Bulls Loading Driven By Accelerating Smart Money Inflows
The price of the Sign token is edging higher, showing an interesting development in its market, according to a revelation disclosed today by market analyst AltsDaddy. The crypto asset is roaring back to life, with its price today surged to $0.052055 while its trading volume reached $202,178,087, as
BlockChainReporter3m ago
Today, the cryptocurrency Fear and Greed Index is at 12, indicating the market is in extreme fear.
Gate News Report, March 8th, according to Alternative.me data, today’s cryptocurrency Fear and Greed Index is at 12, indicating the market is in a "Extreme Fear" state. This index measures market sentiment, with lower values indicating higher levels of fear.
GateNews26m ago
CryptoQuant Analyst: Bitcoin NUPL-MVRV indicator reaches 0.33, indicating that extreme selling conditions are moderating
Gate News Announcement, March 8 — CryptoQuant analyst Axel posted on X platform that Bitcoin may have entered the mid-stage of this bear market cycle. Data shows that the NUPL–MVRV harmonic composite indicator has reached 0.33, while historical cycle bottoms typically occur around the -0.5 level. The chart indicates that the start of the bear market cycle is trending upward, suggesting that extreme selling conditions are moderating. However, the indicator remains well above historical bottom levels, indicating that a full-scale market sell-off has not yet been confirmed.
GateNews1h ago
Polkadot to Reset Tokenomics on March 12 With Major DOT Supply and Staking Changes
Polkadot will introduce a new monetary framework on March 12 that sets DOT’s supply cap at 2.1 billion and lowers emissions by 53.6%.
The overhaul will also create a Dynamic Allocation Pool and shorten the DOT unbonding period from 28 days to 24–48 hours.
On March 12, Polkadot will reset
CryptoNewsFlash5h ago
Bitcoin May Be Closer to a Bottom Than Most Think, Chart Signals
The Bitcoin price slipped about 2% today, trading slightly below $68,000 after pushing above $73,000 earlier this week, as already covered on our site. The move added fresh pressure to a market that still feels shaky, especially after several failed attempts to hold higher levels.
Still, not e
CaptainAltcoin5h ago
Dogecoin Monthly Breakdown Pattern Reappears as Price Tests $0.0918
Dogecoin is currently trading at $0.09205 at a gain of 2.3, with support of above $0.08878.
As can be seen in the monthly chart, there are recurring breakdown areas that have been followed by significant expansions in price.
The short-term trading range is narrow and the immediate point o
CryptoNewsLand5h ago