
Aster price has been moving in a way that feels familiar to anyone who has been watching it closely over the past few weeks. The sharp drop from the highs, the bounce that followed, and the recent hesitation around key levels all seem to trace a path that was already sketched out earlier. One analyst, Ardi also known as @ArdiNSC, laid out that roadmap back in December, and his latest update suggests that ASTER price is still walking along that same line.
The attached chart helps put that idea into context, showing how recent candles line up with the levels Ardi highlighted long before this week’s move unfolded.
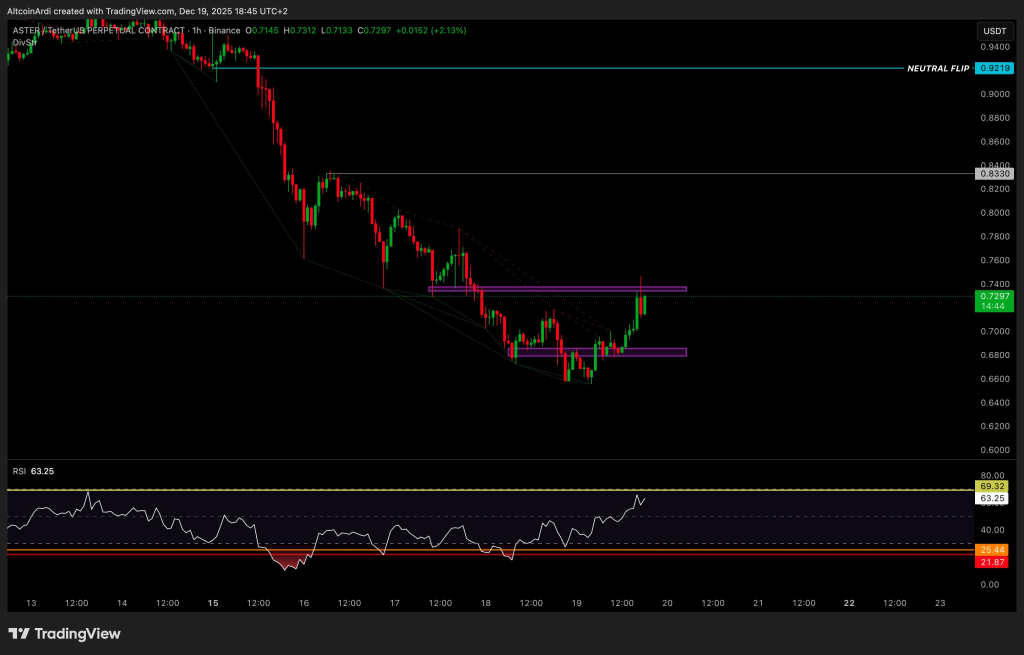
Ardi’s December post described a brutal 32% correction from the $0.98 area, followed by a relief rally off the lows. That is exactly where the story began for Aster. The chart shows a steep sell off that pushed ASTER price down hard, shaking out momentum before buyers stepped in.
That bounce did not come out of nowhere. Relief rallies often appear after fast drops, especially when price reaches areas where selling pressure temporarily dries up. On the chart, that reaction is clear as price stabilizes and starts climbing away from the lows, creating the first leg of the move Ardi described.
@ArdiNSC / X
- Aster Price Pushed Into The $0.79 To $0.83 Overhead Zone And Set A Lower High
- The Chart Shows Key Support Being Tested Near The Range Lows
- Aster Price Structure Still Follows The Original Thesis
Aster Price Pushed Into The $0.79 To $0.83 Overhead Zone And Set A Lower High
The next part of Ardi’s roadmap focused on an overhead zone between $0.79 and $0.83. The chart highlights this area clearly, with price pushing into that range and struggling to move beyond it. Candles cluster below the zone, showing hesitation rather than strength.
This behavior matters because it frames the rally as corrective rather than the start of a new uptrend. Aster price did bounce, yet the inability to reclaim higher levels turned that bounce into a lower high. The chart visually reinforces this idea by showing how price rolled over after testing that overhead region.
The Chart Shows Key Support Being Tested Near The Range Lows
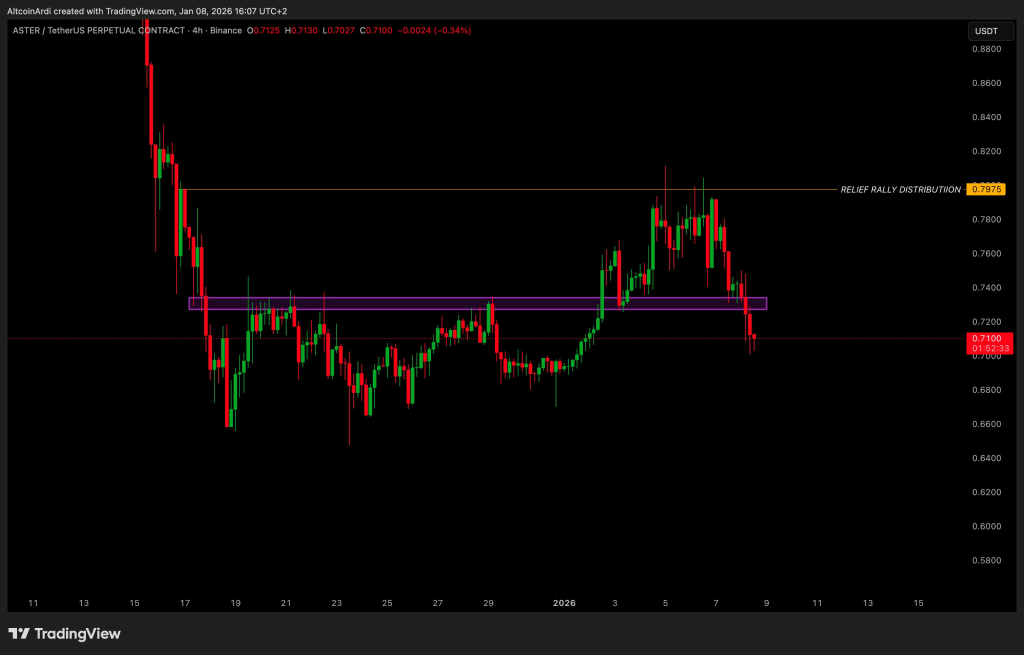
After failing to hold above the overhead zone, ASTER price started drifting back down. The purple highlighted area on the chart marks a support region that previously acted as a base during consolidation. Recent candles show price slipping back into that zone and pressing against it.
This is where Ardi’s second post becomes especially relevant. He explained that from the lower high, price either resumes the macro flush or settles into consolidation near the range lows. The chart suggests that ASTER price is now at that decision point, with sellers pushing price toward support while buyers attempt to defend it.
@ArdiNSC / X
Ardi’s base case remains clear. His latest post points to a possible sweep of the macro low near $0.61 if support fails. The chart does not show that level being reached yet, yet the structure explains why it remains on the table.
Price sits below major resistance and has not reclaimed the neutral zone Ardi identified earlier near $0.92. Without that reclaim, the broader structure stays fragile. The steady pressure toward lower levels on the chart supports the idea that downside risk has not disappeared, even if short-term consolidation develops first.
Aster Price Structure Still Follows The Original Thesis
What stands out most is how closely current price action mirrors the December thesis. The relief rally, the push into overhead resistance, and the retreat back toward range lows are all visible on the chart. ASTER price has not done anything dramatic outside that script.
How Much Will XRP Be Worth at the Bitcoin, Silver, or Apple Market Cap?_**
That alignment does not guarantee what happens next, yet it explains why Ardi continues to reference the same roadmap. The chart attached makes his second post easier to understand, showing that the market has respected those levels step by step rather than randomly.
Aster price now sits in a quiet but important phase. The coming sessions will show whether consolidation holds near support or whether the broader flush Ardi outlined continues to unfold. Either way, the chart suggests that this story is still being written, and the next chapter may arrive sooner than many expect.
Disclaimer: The information on this page may come from third parties and does not represent the views or opinions of Gate. The content displayed on this page is for reference only and does not constitute any financial, investment, or legal advice. Gate does not guarantee the accuracy or completeness of the information and shall not be liable for any losses arising from the use of this information. Virtual asset investments carry high risks and are subject to significant price volatility. You may lose all of your invested principal. Please fully understand the relevant risks and make prudent decisions based on your own financial situation and risk tolerance. For details, please refer to
Disclaimer.
Related Articles
Dogecoin, Pepe, and Shiba Inu Slide as Bitcoin Falls Below $70K
Bitcoin's drop below $70K triggers a selloff in meme coins like Dogecoin and Shiba Inu, causing increased market volatility. Despite a surge in Shiba Inu's burn activity, its price declines alongside Dogecoin, which struggles with weak momentum.
CryptoBreaking12m ago
Bitmine accelerated purchases last week with 60,976 ETH! Tom Lee: Ethereum is in the late stage of the "bear market," and the bottom could be seen as early as this week.
Ethereum reserve company Bitmine announced its holdings on March 9, accumulating 4.535 million ETH with total assets reaching $10.3 billion. Chairman Tom Lee stated that they have recently accelerated their purchase by 60,976 ETH and believe that Ethereum is currently in the late stage of a small bear market, with the bottom estimated between March 8 and 14. Bitmine has staked 3.04 million ETH, generating an annualized yield of $174 million, and plans to launch its own staking infrastructure, MAVAN.
動區BlockTempo31m ago
Ethereum Breakout Signals Short-Term Upside
The recent bullish sentiment in the crypto market is driven by Ethereum's breakout from a downward trendline, indicating potential price targets of $2,050 and $2,085. While the volatility remains, analysts are optimistic about Ethereum's long-term prospects contingent on market adoption.
Coinfomania41m ago
SXP Price Surges 11.59%: What This Could Mean for Traders
SXP has surged 11.59% amid a generally declining crypto market, reaching $0.0231. This increase reflects heightened investor interest, driven by market dynamics and trading activity, as traders eye key resistance and support levels.
Coinfomania51m ago
BitMine increased its holdings by 60,976 ETH last week. The Executive Chairman states that ETH may bottom out in mid-month.
BitMine announced that as of March 8, its total assets reached $10.3 billion, including 4,534,563 ETH and 195 BTC. Executive Chairman Tom Lee stated that amidst market uncertainty, ETH has shown resilience, and its price is expected to bottom out between March 8 and 14. Meanwhile, BitMine is accelerating its ETH accumulation, with staked ETH reaching 3,040,483.
GateNews56m ago
Oil prices rise to $119, reaching a new high since 2022, Bitcoin remains at $67,000, and the Federal Reserve has a 99% probability of maintaining interest rates in March.
On March 9th, WTI crude oil prices rose to $119 per barrel, reaching a new high since 2022. Due to threats from Iran, global crude oil supply losses approached 20 million barrels. Bitcoin remained at $67,000, with no signs of panic selling. The probability that the Federal Reserve will keep interest rates unchanged is approximately 99%.
GateNews1h ago