
**Date: **Wed, Jan 07, 2026 | 10:40 AM GMT
Key Takeaways:
-
Whale Activity: Three wallets linked to a single entity accumulated 3,000 BTC during this week’s price dip.
-
Technical Setup: BTC is forming an Ascending Triangle on the daily chart, a classic bullish continuation signal.
-
Key Levels: Support at $89,900 is the line in the sand; a breakout above $95,000 triggers the $108K target.
The broader cryptocurrency market is showing a mild pullback today after a strong start to the year. Bitcoin (BTC), which had rallied close to the $94,000 mark earlier this week, has cooled off and is now trading below $92,000, down around 1.89% on the day.
While short-term price action reflects some profit-taking, activity beneath the surface tells a different story. Large holders appear to be positioning for a bigger move, and the latest daily chart structure continues to hint at a potential upside resolution.
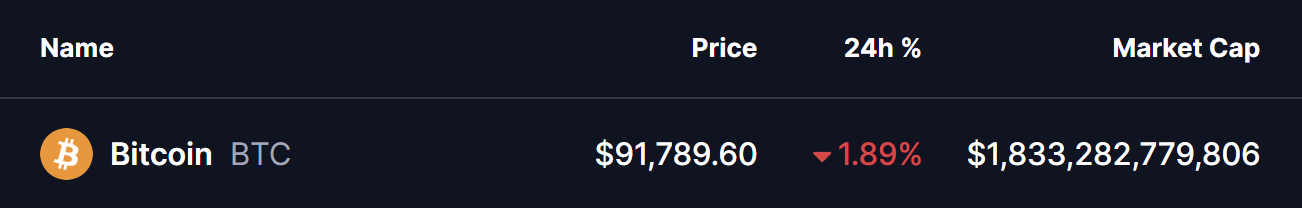
Source: Coinmarketcap
Is This Whale Buying a Sign of the Next BTC Breakout?
As Bitcoin gained momentum over the past several sessions, whales quietly stepped in with significant accumulation. According to data shared by Lookonchain, three wallets — potentially linked to the same entity — accumulated a combined 3,000 BTC worth roughly $280 million just hours ago.
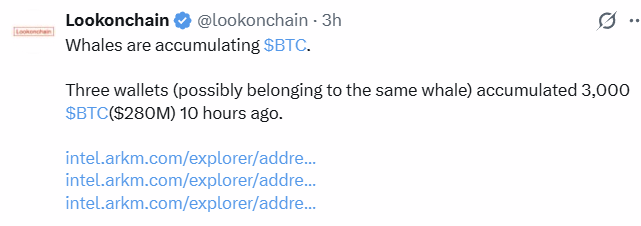
Source: Lookonchain (X)
This type of buying activity during a pullback often suggests long-term conviction rather than short-term speculation.
Ascending Triangle Taking Shape on the Daily Chart
On the daily timeframe, BTC appears to be forming an ascending triangle pattern — a structure commonly associated with bullish continuation when confirmed.
The pattern is defined by a rising trendline that has consistently supported higher lows since December, while price continues to face resistance in the $94,000–$95,000 zone. Each pullback has been increasingly shallow, signaling steady demand at higher price levels.
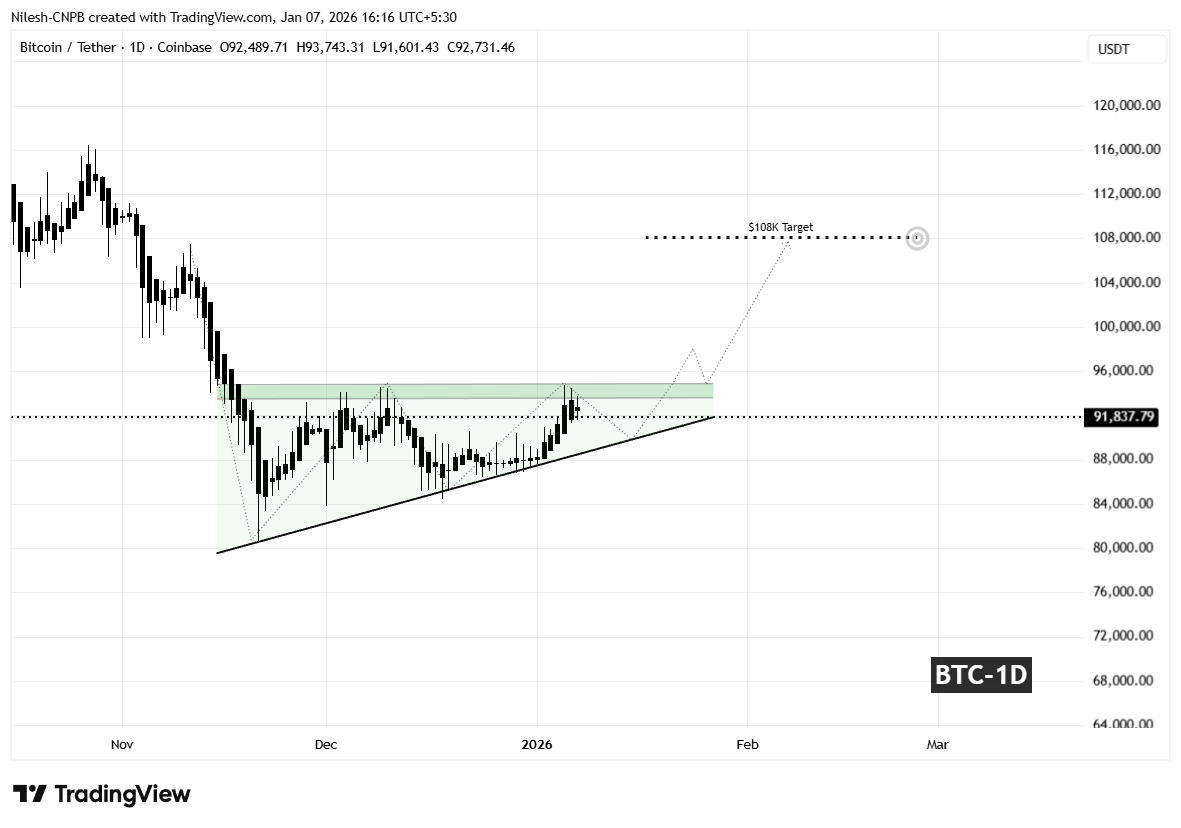
Bitcoin (BTC) Daily Chart/Coinsprobe (Source: Tradingview)
Today’s rejection from resistance pushed BTC back below $92,000, but price remains well above the ascending support trendline. A controlled pullback toward the $89,900–$90,000 area would still keep the broader structure intact and could serve as a healthy reset before the next attempt higher.
Will BTC Hit $108,000? The Scenario Outlook
The $89,000–$90,000 region now plays a crucial role in maintaining bullish structure. As long as BTC continues to hold above this rising trendline, the probability of another move toward the $94,000–$95,000 resistance zone remains elevated.
A decisive daily close above horizontal resistance would confirm an ascending triangle breakout and shift momentum firmly back in favor of the bulls. Such a move could also trigger fresh participation from sidelined buyers.
Based on the measured move projection of the triangle, a confirmed breakout points toward a potential upside target near $108,000 — matching the extension zone marked on the chart. From the breakout area, this would represent roughly a 14% upside move.
On the flip side, failure to hold the ascending support could invalidate the pattern and expose BTC to a deeper corrective move. Until either scenario is confirmed, price action within this structure remains a battle between patient accumulation and short-term selling pressure.
The Bottom Line: While Bitcoin (BTC) has dipped below $92,000, “Smart Money” is using the pullback to load up. On-chain data confirms that three major whales just accumulated $280 million in BTC. Technically, Bitcoin is coiled inside a massive Ascending Triangle, with a confirmed breakout targeting the $108,000 level.
Disclaimer: The views and analysis presented in this article are for informational purposes only and reflect the author’s perspective, not financial advice. Technical patterns and indicators discussed are subject to market volatility and may or may not yield the anticipated results. Investors are advised to exercise caution, conduct independent research, and make decisions aligned with their individual risk tolerance.
About Author: Nilesh Hembade is the Founder and Lead Author of Coinsprobe, with over 5 years of experience in the cryptocurrency and blockchain industry. Since launching Coinsprobe in 2023, he has been providing daily, research-driven insights through in-depth market analysis, on-chain data, and technical research.
Disclaimer: The information on this page may come from third parties and does not represent the views or opinions of Gate. The content displayed on this page is for reference only and does not constitute any financial, investment, or legal advice. Gate does not guarantee the accuracy or completeness of the information and shall not be liable for any losses arising from the use of this information. Virtual asset investments carry high risks and are subject to significant price volatility. You may lose all of your invested principal. Please fully understand the relevant risks and make prudent decisions based on your own financial situation and risk tolerance. For details, please refer to
Disclaimer.
Related Articles
Aster Price Nears $0.79 Breakout as Reversal Pattern Strengthens
Key Insights
Aster price structure shows an inverse head and shoulders pattern forming beneath $0.79 resistance, signaling growing buying pressure and possible trend reversal ahead.
Repeated tests of the $0.79 neckline suggest weakening selling pressure as buyers steadily absorb supply
CryptoFrontNews49m ago
The HYPE price could surge despite the upcoming $2.8 million short squeeze.
The recent price movements of Hyperliquid (HYPE) are characterized by stagnation around 30 USD. A symmetrical triangle pattern indicates potential for a breakout in either direction, but market sentiment is cautious. Short squeeze risks may boost prices, while weak market flow and deteriorating demand pose challenges. The token could face significant support levels if it dips below 30 USD. An improved market sentiment could lead to a breakout above 33 USD, sparking recovery momentum.
TapChiBitcoin1h ago
Ethereum Price Holds Key Support: Is $2,200 the Next Test for ETH?
March 6, 2026 7:15 pm EST
TheCoinRepublic2h ago
Cardano Price Trends: Bulls Eye Opportunity as Indicator Flashes Green
ADA: Trading near $0.27, facing resistance at $0.28 and support at $0.26.
Technical Indicators: RSI and MACD show weak momentum, signaling short-term consolidation and cautious trading.
Macro Outlook: Rising PMI and historical patterns suggest potential bullish rebound if resistance
CryptoNewsLand3h ago
CryptoQuant: Bitcoin NUPL--MVRV indicator reaches 0.33, or has entered the mid-stage of a bear market
Gate News Announcement, March 7th, CryptoQuant analyst Axel pointed out on the X platform that the Bitcoin NUPL--MVRV harmonic composite indicator has reached 0.33, while historical cycle bottoms typically occur around the 0.5 range. The chart shows that the bear market cycle is beginning to shift upward, indicating that Bitcoin may have entered the mid-stage of this bear market cycle, suggesting that extreme selling conditions are easing. However, this indicator is still well above historical bottom levels, implying that a market-wide bottom has not yet been confirmed.
GateNews3h ago
ZEC Price Analysis: Upcoming Trends and Targets for the Next Few Weeks
ZEC: Stabilized near $200 support, rebounding toward $250 resistance after prolonged bearish pressure.
Technical Indicators: RSI and MACD show gradual improvement, signaling moderate bullish momentum returning.
Market Outlook: Sustained above $240 could push ZEC toward $268, while
CryptoNewsLand4h ago