
Key Highlights: Canton (CC) Technical Setup
-
Bullish Chart Pattern: Canton (CC) has confirmed a textbook Cup-and-Handle breakout on the daily timeframe, a structure typically signaling the start of a massive uptrend.
-
Critical Support Zone: Price is currently undergoing a “healthy” retest of the $0.1390 neckline. This former resistance-turned-support aligns with a major institutional demand block.
-
Institutional Catalyst: The technical breakout follows news of JPMorgan and Lloyds Bank integrating the Canton Network for real-world asset (RWA) tokenization and settlement.
-
Market Resilience: Despite Bitcoin (BTC) slipping below $90,000, $CC is showing relative strength by holding its breakout structure, signaling strong dip-buying activity.
The broader cryptocurrency market is taking a breather after a strong start to the year. Bitcoin (BTC), which surged close to the $94,000 level earlier this week, has slipped back below $90,000, dragging overall market sentiment slightly lower. Ethereum (ETH) is also under pressure, down around 3% on the day.
However, while the majors altcoins retreat, Canton (CC) is quietly flashing a technically “constructive” setup. Backed by a wave of RWA (Real World Asset) tokenization news, the CC daily chart suggests a massive bullish move is brewing beneath the surface.
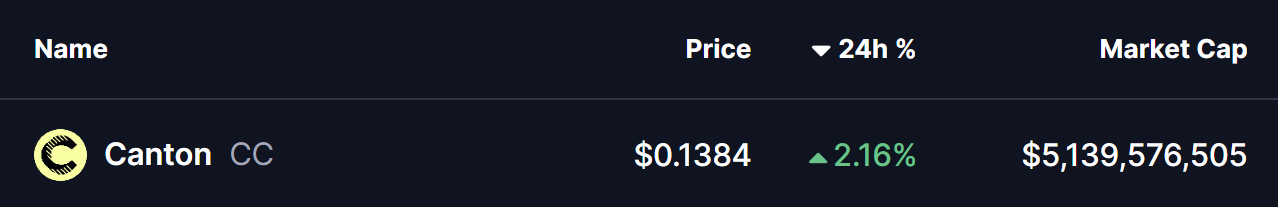
Source: Coinmarketcap
Fundamental Catalyst: The JPMorgan & Lloyds Bank Effect
Canton’s resilience isn’t accidental. On January 7, 2026, the network saw two massive institutional wins:
-
JPMorgan announced a phased 2026 rollout of JPM Coin natively on the Canton Network.
-
Lloyds Banking Group executed the UK’s first tokenized gilt transaction on the platform.
These milestones have transformed $CC from a speculative altcoin into a critical piece of global financial infrastructure, providing the fundamental “fuel” for the current chart breakout.

Source: @CantonFdn (X)
Cup-and-Handle Breakout Enters Retest Phase
On the daily timeframe, Canton had been consolidating within a textbook cup-and-handle formation, a bullish continuation structure that often precedes strong upside expansion once confirmed.
This pattern began forming in early November after CC faced rejection near the $0.1360 resistance zone. That rejection led to a prolonged decline, with price eventually bottoming around $0.0586. From that low, selling pressure gradually faded and buyers stepped in consistently, allowing price to carve out a smooth, rounded base over several weeks — a classic cup structure.
The consolidation resolved with a clean breakout above the neckline near $0.1390, propelling CC sharply higher toward a local peak at $0.1768. Following this impulsive move, price entered a controlled pullback — a normal and healthy behavior after a breakout — setting up a retest of the former resistance area.
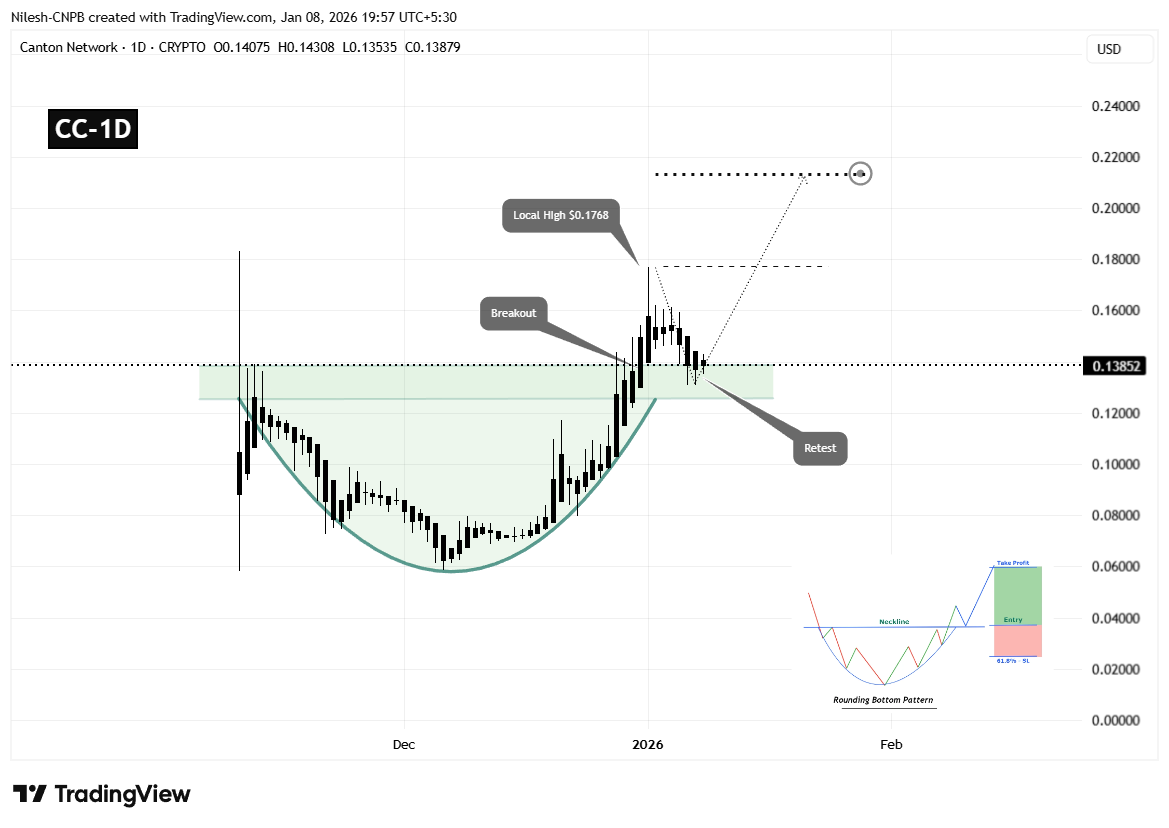
Canton (CC) Daily Chart/Coinsprobe (Source: Tradingview)
Currently, CC is trading back near the $0.1390 region, which now acts as a resistance-turned-support zone. This area also overlaps with the broader demand block highlighted on the chart, making it a technically important level for the next directional move.
What the Chart Suggests Next for CC
The ongoing retest phase remains constructive as long as buyers continue to defend the $0.1390–$0.1308 support zone. A strong reaction from this region would signal that market participants are using the pullback to accumulate rather than exit positions.
If support holds and bullish momentum resumes, the first upside objective would be a reclaim of the $0.1768 local high. A decisive move above this level would reinforce bullish control and confirm strength following the breakout-retest structure.
Based on the measured move projection of the broader rounding bottom and cup formation, a successful continuation could push CC toward the $0.2130 region. This target aligns with the projected extension shown on the chart and represents approximately 50%–55% upside from the breakout zone.
On the flip side, failure to hold above the $0.1308 support area would weaken the bullish setup and increase the risk of a deeper pullback, potentially turning the recent breakout into a failed move.
For now, the structure favors patience. As long as CC maintains support and avoids aggressive rejection from this retest zone, the broader technical outlook continues to lean bullish.
Why is Canton (CC) rising in 2026?
The rise is driven by institutional adoption. Major entities like the DTCC and JPMorgan are using Canton for tokenizing U.S. Treasuries and cross-border settlements.
Disclaimer: The views and analysis presented in this article are for informational purposes only and reflect the author’s perspective, not financial advice. Technical patterns and indicators discussed are subject to market volatility and may or may not yield the anticipated results. Investors are advised to exercise caution, conduct independent research, and make decisions aligned with their individual risk tolerance.
About Author: Nilesh Hembade is the Founder and Lead Author of Coinsprobe, with over 5 years of experience in the cryptocurrency and blockchain industry. Since launching Coinsprobe in 2023, he has been providing daily, research-driven insights through in-depth market analysis, on-chain data, and technical research.
Disclaimer: The information on this page may come from third parties and does not represent the views or opinions of Gate. The content displayed on this page is for reference only and does not constitute any financial, investment, or legal advice. Gate does not guarantee the accuracy or completeness of the information and shall not be liable for any losses arising from the use of this information. Virtual asset investments carry high risks and are subject to significant price volatility. You may lose all of your invested principal. Please fully understand the relevant risks and make prudent decisions based on your own financial situation and risk tolerance. For details, please refer to
Disclaimer.
Related Articles
Aster Price Nears $0.79 Breakout as Reversal Pattern Strengthens
Key Insights
Aster price structure shows an inverse head and shoulders pattern forming beneath $0.79 resistance, signaling growing buying pressure and possible trend reversal ahead.
Repeated tests of the $0.79 neckline suggest weakening selling pressure as buyers steadily absorb supply
CryptoFrontNews2h ago
The HYPE price could surge despite the upcoming $2.8 million short squeeze.
The recent price movements of Hyperliquid (HYPE) are characterized by stagnation around 30 USD. A symmetrical triangle pattern indicates potential for a breakout in either direction, but market sentiment is cautious. Short squeeze risks may boost prices, while weak market flow and deteriorating demand pose challenges. The token could face significant support levels if it dips below 30 USD. An improved market sentiment could lead to a breakout above 33 USD, sparking recovery momentum.
TapChiBitcoin2h ago
Ethereum Price Holds Key Support: Is $2,200 the Next Test for ETH?
March 6, 2026 7:15 pm EST
TheCoinRepublic4h ago
Cardano Price Trends: Bulls Eye Opportunity as Indicator Flashes Green
ADA: Trading near $0.27, facing resistance at $0.28 and support at $0.26.
Technical Indicators: RSI and MACD show weak momentum, signaling short-term consolidation and cautious trading.
Macro Outlook: Rising PMI and historical patterns suggest potential bullish rebound if resistance
CryptoNewsLand5h ago
CryptoQuant: Bitcoin NUPL--MVRV indicator reaches 0.33, or has entered the mid-stage of a bear market
Gate News Announcement, March 7th, CryptoQuant analyst Axel pointed out on the X platform that the Bitcoin NUPL--MVRV harmonic composite indicator has reached 0.33, while historical cycle bottoms typically occur around the 0.5 range. The chart shows that the bear market cycle is beginning to shift upward, indicating that Bitcoin may have entered the mid-stage of this bear market cycle, suggesting that extreme selling conditions are easing. However, this indicator is still well above historical bottom levels, implying that a market-wide bottom has not yet been confirmed.
GateNews5h ago
ZEC Price Analysis: Upcoming Trends and Targets for the Next Few Weeks
ZEC: Stabilized near $200 support, rebounding toward $250 resistance after prolonged bearish pressure.
Technical Indicators: RSI and MACD show gradual improvement, signaling moderate bullish momentum returning.
Market Outlook: Sustained above $240 could push ZEC toward $268, while
CryptoNewsLand6h ago