
Date: Sat, Jan 03, 2026 | 06:50 PM GMT
As 2026 kicks off, the broader cryptocurrency market is showing renewed stability. Ethereum (ETH) has reclaimed the $3,100 mark, and momentum is gradually spreading across major altcoins — including Bittensor (TAO).
TAO is trading around 3% higher on the day, extending its weekly gains to nearly 14%. While the short-term strength is encouraging, the more important development lies in the structure forming on the chart. Recent price action suggests a meaningful shift in market behavior — one that could signal the early stages of a bullish continuation if key levels are reclaimed.
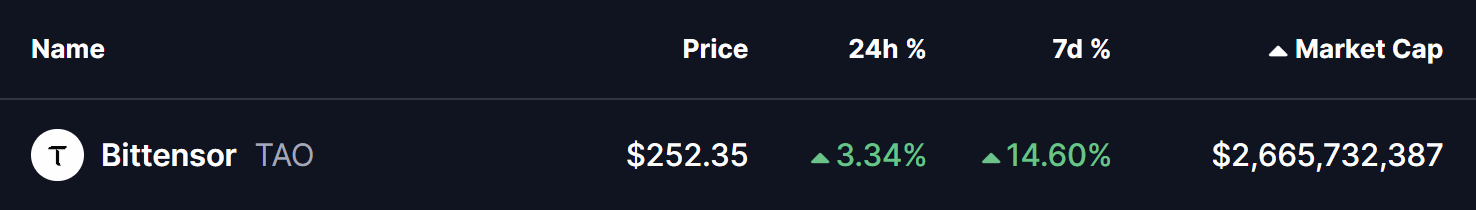
Source: Coinmarketcap
Rounding Bottom Pattern Takes Shape
On the 4-hour timeframe, Bittensor appears to be forming a rounding bottom pattern, a classic bullish reversal structure that typically develops after an extended corrective phase. This pattern reflects a gradual transition from distribution to accumulation, where selling pressure fades and buyers begin to step in more consistently.
The setup began after TAO faced a firm rejection near the $315 neckline resistance, which triggered a sharp decline through late November and December. That move eventually found strong demand near the $206 support zone, where selling momentum stalled. Multiple defenses of this level prevented any deeper breakdown and helped establish a solid base for a potential trend reversal.
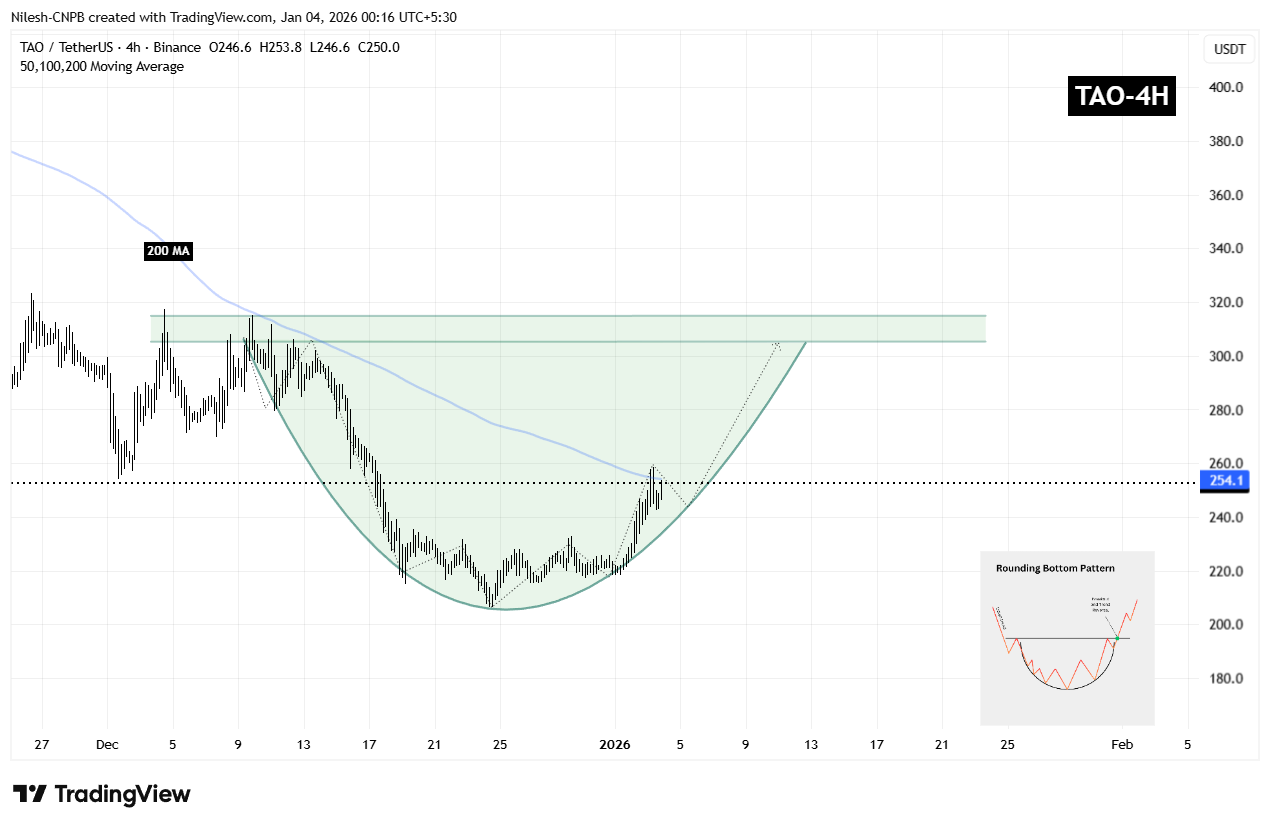
Bittensor (TAO) 4H Chart/Coinsprobe (Source: Tradingview)
Since carving out that bottom, TAO has started to curve higher in a smooth, rounded fashion — closely matching the textbook structure of a developing rounding bottom. The recent recovery has also brought price back toward the 200-period moving average near $254, a level that previously acted as resistance and is now being tested as potential support.
What’s Next for TAO?
If TAO manages to hold above the 200 MA, that level could act as short-term support and provide a foundation for further upside attempts. A clean breakout above the $315 resistance zone, followed by sustained acceptance above it, would validate the entire reversal structure and likely open the door for a broader bullish expansion phase, with momentum traders re-entering the market.
Until that breakout occurs, the pattern remains in development. Short-term consolidation or shallow pullbacks remain possible, particularly as price digests recent gains. However, as long as TAO continues to maintain higher lows above the established base, the broader bottoming structure remains intact and constructive.
For now, the chart suggests that TAO is approaching a critical confirmation phase — one that could determine whether this recovery evolves into a sustained bullish trend as the new year unfolds.
Disclaimer: The views and analysis presented in this article are for informational purposes only and reflect the author’s perspective, not financial advice. Technical patterns and indicators discussed are subject to market volatility and may or may not yield the anticipated results. Investors are advised to exercise caution, conduct independent research, and make decisions aligned with their individual risk tolerance.
About Author: Nilesh Hembade is the Founder and Lead Author of Coinsprobe, with over 5 years of experience in the cryptocurrency and blockchain industry. Since launching Coinsprobe in 2023, he has been providing daily, research-driven insights through in-depth market analysis, on-chain data, and technical research.
Disclaimer: The information on this page may come from third parties and does not represent the views or opinions of Gate. The content displayed on this page is for reference only and does not constitute any financial, investment, or legal advice. Gate does not guarantee the accuracy or completeness of the information and shall not be liable for any losses arising from the use of this information. Virtual asset investments carry high risks and are subject to significant price volatility. You may lose all of your invested principal. Please fully understand the relevant risks and make prudent decisions based on your own financial situation and risk tolerance. For details, please refer to
Disclaimer.
Related Articles
Expert Claims Altcoin Metrics Are Being 'Gamed' to Mislead Investors
Crypto researcher Orbion raises concerns over the possible manipulation of key market indicators, including the Altseason Index and Crypto Fear and Greed Index, suggesting that inflated metrics create false optimism and mislead investors about the onset of altcoin season.
Coinpedia44m ago
XRP Holds $1.34 Support as $1.80–$2.00 Becomes 2025 Make-or-Break Zone
XRP is trading at $1.37 and its trading higher than the support of $1.34 but facing a heavy resistance at $1.38.
The critical structural pivot zone of $1.80-2.00 is the critical 2025 structural pivot.
March structure has the targets of $2.78 and 3.60, with anticipated
CryptoNewsLand47m ago
XRP Slides to $1.42 After Losing $1.80–$2 Neckline as $1.39 Support Faces Immediate Test
XRP dropped to less than the $1.80-2 neckline and a key support area became an overhead and the overall trend was altered.
The current short-term trading corridor is between the support and resistance of the asset which is between $1.39 and $1.47 respectively.
A price above $1.39 will
CryptoNewsLand52m ago
Dogecoin Prints Monthly Morning Doji Star — Will $0.097 Break Next?
Dogecoin is forming a "Morning Doji Star" pattern on the monthly chart around $0.09, indicating a potential bullish reversal despite a recent 1.9% daily decline. Key support is at $0.09036 and resistance at $0.09707, with current trading at $0.09010.
CryptoNewsLand56m ago
Solana at $84: Two Liquidity Clusters Might Decide Next Move - U.Today
Solana's payments volume surges 755%, but its price drops 1.40% amid profit-taking and a stronger dollar. Market sentiment remains cautious, with two liquidity clusters forming at $95 and $78-$85, indicating potential future volatility.
UToday1h ago
PEPE Price Coils Within $0.053385–$0.053517 Band as Momentum Stays Balanced
PEPE is trading within a tight range, with support at $0.053385 and resistance at $0.053517. The token shows minimal daily gains and balanced momentum indicators, indicating potential for volatility. Despite limited movement against USDT, PEPE appreciates against BTC and ETH.
CryptoNewsLand1h ago