
**Date: **Wed, Jan 07, 2026 | 06:20 AM GMT
The broader cryptocurrency market continues to show strong New Year momentum, with Bitcoin (BTC) up around 4% and Ethereum (ETH) gaining over 9% on a weekly basis. This improving sentiment is gradually spilling over into major altcoins — including the DePIN-focused token Akash Network (AKT).
AKT has already posted an impressive 20% weekly gain. While this short-term strength has caught traders’ attention, the more important development is unfolding on the higher-timeframe chart. Recent price action suggests a meaningful shift in market structure, hinting that AKT may be transitioning out of a prolonged corrective phase and into the early stages of a bullish continuation.
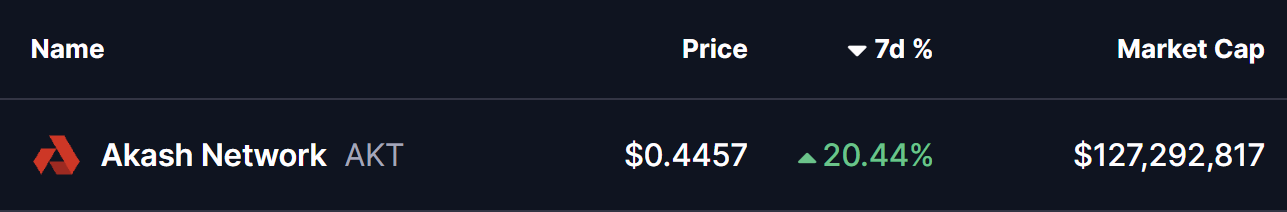
Source: Coinmarketcap
Falling Wedge and Rounding Bottom in Play
On the daily chart, AKT has been trading within a broader falling wedge — a structure that often precedes bullish reversals as selling pressure gradually weakens. Within this larger wedge, price action is also shaping a developing rounding bottom pattern, reflecting steady accumulation and seller exhaustion.
The formation began after AKT faced strong rejection near the $0.5441 resistance zone in late November. That rejection triggered a sharp sell-off, pushing price lower toward the $0.3465 region. However, bears failed to extend losses beyond this area. Instead, demand stepped in, downside momentum slowed, and price began to stabilize.
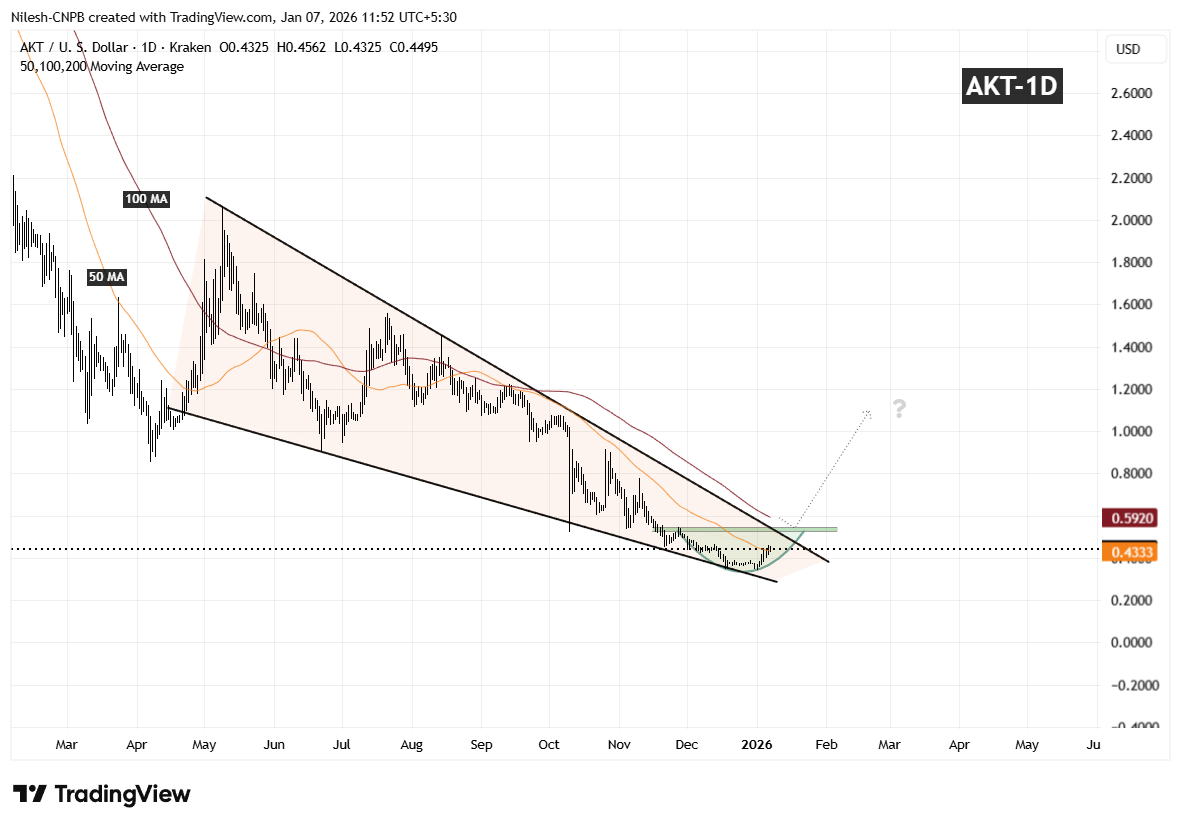
Akash Network (AKT) Daily Chart/Coinsprobe (Source: Tradingview)
Over the following weeks, volatility compressed and AKT started to curl higher in a smooth, rounded fashion — closely matching the textbook behavior of a rounding bottom. Importantly, the recent rebound has pushed price back above the 50-day moving average around $0.4333, a level that had previously acted as resistance and is now beginning to flip into support.
What’s Next for AKT?
If AKT can continue to hold above the 50-day moving average, this area may act as a solid base for further upside attempts. From here, attention shifts toward the descending resistance trendline of the falling wedge, which aligns closely with the $0.5441 resistance zone.
A clean and decisive breakout above this confluence area, followed by sustained acceptance, would confirm a broader bullish expansion phase and mark a clear trend reversal from the prior downtrend. Such a move would likely attract renewed momentum participation as the market recognizes the structural shift.
Until that breakout occurs, the pattern remains in development. Short-term consolidation or shallow pullbacks are still possible as price digests recent gains. However, as long as AKT continues to print higher lows above the established base, the broader technical structure remains constructive.
Overall, the chart suggests AKT is approaching a critical inflection point — one that could determine whether this recovery evolves into a sustained bullish trend as 2026 progresses.
Disclaimer: The views and analysis presented in this article are for informational purposes only and reflect the author’s perspective, not financial advice. Technical patterns and indicators discussed are subject to market volatility and may or may not yield the anticipated results. Investors are advised to exercise caution, conduct independent research, and make decisions aligned with their individual risk tolerance.
About Author: Nilesh Hembade is the Founder and Lead Author of Coinsprobe, with over 5 years of experience in the cryptocurrency and blockchain industry. Since launching Coinsprobe in 2023, he has been providing daily, research-driven insights through in-depth market analysis, on-chain data, and technical research.
Disclaimer: The information on this page may come from third parties and does not represent the views or opinions of Gate. The content displayed on this page is for reference only and does not constitute any financial, investment, or legal advice. Gate does not guarantee the accuracy or completeness of the information and shall not be liable for any losses arising from the use of this information. Virtual asset investments carry high risks and are subject to significant price volatility. You may lose all of your invested principal. Please fully understand the relevant risks and make prudent decisions based on your own financial situation and risk tolerance. For details, please refer to
Disclaimer.
Related Articles
PEPE Price Coils Within $0.053385–$0.053517 Band as Momentum Stays Balanced
PEPE is trading within a tight range, with support at $0.053385 and resistance at $0.053517. The token shows minimal daily gains and balanced momentum indicators, indicating potential for volatility. Despite limited movement against USDT, PEPE appreciates against BTC and ETH.
CryptoNewsLand15m ago
1.7 Billion Cardano in 24 Hours, ADA Bulls React to Market Sentiment Shift - U.Today
Cardano (ADA) has seen significant trading activity recently, with a drop in price from $0.2682 to $0.2590 amid rising selling pressure and global tensions. Increased selling and market sentiment could challenge ADA's stability, but recent adoption efforts may support recovery if trading volumes rise.
UToday1h ago
Geopolitical Turmoil! Dalio Declares "Gold is the Only True God," but Its Safe-Haven Performance Trails Bitcoin
As geopolitical tensions in the Middle East escalate, Bridgewater founder Ray Dalio questions Bitcoin and reaffirms gold as the preferred safe haven. Nevertheless, gold prices fell accordingly, while Bitcoin only experienced a slight correction, indicating that the correlation between the two is weakening. Dalio doubts Bitcoin's transparency and future risks, but he still maintains a small allocation of Bitcoin for diversification.
区块客2h ago
Interest in altcoins cools down: Can Ethereum trigger a new altcoin season?
The market is forcing investors to bring risk management back to the center.
From a technical perspective, the inflow of funds over the past week has driven
TapChiBitcoin2h ago
Aster Price Nears $0.79 Breakout as Reversal Pattern Strengthens
Key Insights
Aster price structure shows an inverse head and shoulders pattern forming beneath $0.79 resistance, signaling growing buying pressure and possible trend reversal ahead.
Repeated tests of the $0.79 neckline suggest weakening selling pressure as buyers steadily absorb supply
CryptoFrontNews5h ago
The HYPE price could surge despite the upcoming $2.8 million short squeeze.
The recent price movements of Hyperliquid (HYPE) are characterized by stagnation around 30 USD. A symmetrical triangle pattern indicates potential for a breakout in either direction, but market sentiment is cautious. Short squeeze risks may boost prices, while weak market flow and deteriorating demand pose challenges. The token could face significant support levels if it dips below 30 USD. An improved market sentiment could lead to a breakout above 33 USD, sparking recovery momentum.
TapChiBitcoin5h ago