
**Date: **Wed, Jan 07, 2026 | 08:00 AM GMT
The broader cryptocurrency market continues to show strong New Year momentum, with Bitcoin (BTC) up nearly 4% and Ethereum (ETH) posting weekly gains of over 9%. This improving risk sentiment is now extending beyond majors and into select altcoins — including Pudgy Penguins (PENGU).
PENGU has already delivered an impressive 45% gain over the past week. While the rally itself is notable, the more important development lies in the underlying market structure. Recent price behavior on the daily chart suggests that PENGU may be approaching a pivotal breakout zone, one that could define the next directional move.
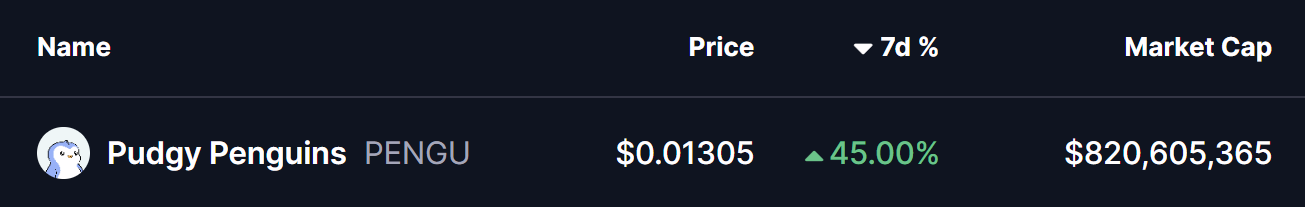
Source: Coinmarketcap
Right-Angled Descending Broadening Pattern in Play
On the daily timeframe, PENGU had been trading within a right-angled descending broadening formation — a bullish reversal pattern characterized by repeated rejections at a flat resistance level and gradually rising downside volatility.
For several weeks, price remained capped beneath the $0.01294–$0.01381 resistance band. Each attempt to push higher was met with selling pressure, keeping PENGU locked in consolidation while the lower boundary of the structure continued to expand.
That dynamic changed after a strong rebound from the lower trendline. Buyers stepped in decisively, triggering a sharp upside move that allowed PENGU to reclaim the 50-day moving average around $0.01062. This level had previously acted as persistent dynamic resistance, and reclaiming it marked a clear shift in short-term momentum.
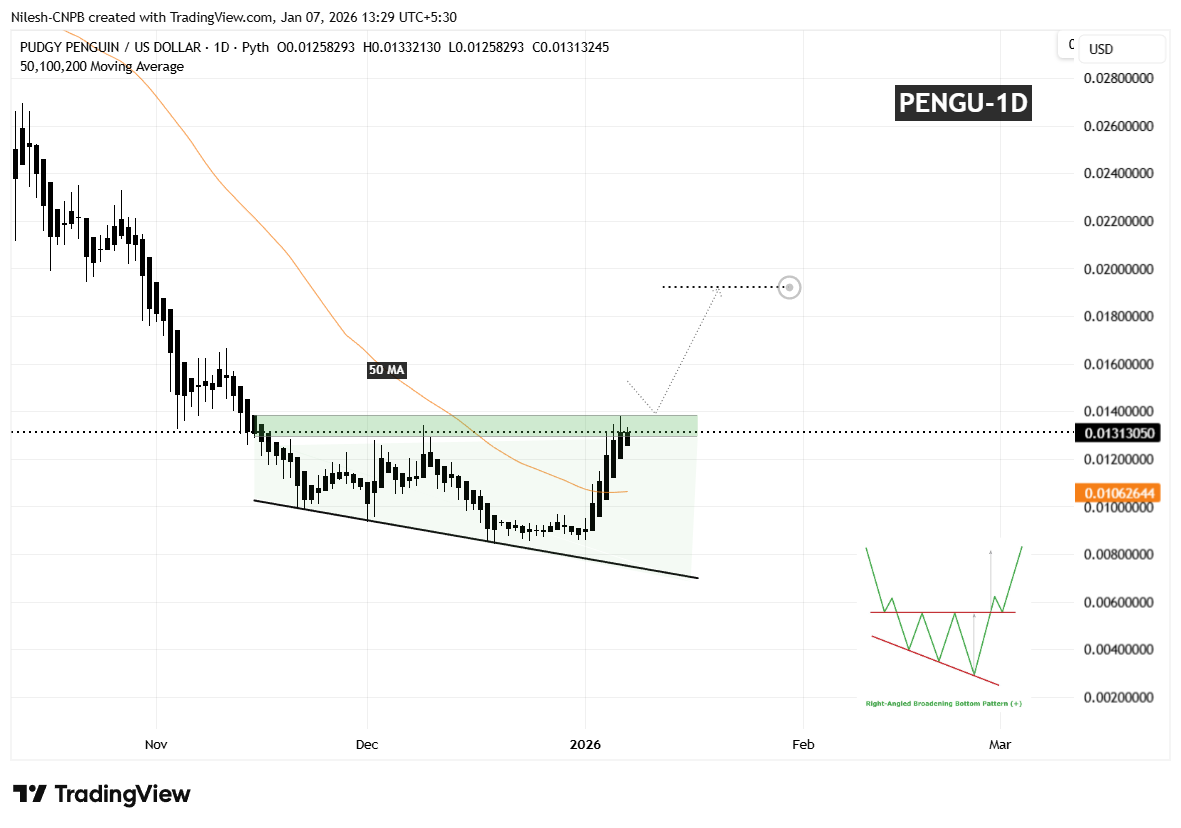
Pudgy Penguins (PENGU) Daily Chart/Coinsprobe (Source: Tradingview)
Following this reclaim, upside strength accelerated, and price has now returned to the same resistance zone that rejected advances multiple times in the past. This move back into resistance places PENGU at a critical inflection point, where market participants are once again being tested.
What’s Next for PENGU?
A decisive daily close above the $0.01294–$0.01381 resistance area would confirm a breakout from the descending broadening formation and validate the broader bullish reversal setup. Sustained acceptance above this zone would likely invite fresh momentum participation, as traders recognize the structural shift underway.
Based on the depth of the pattern and its measured move projection, a successful breakout could open the door toward the $0.01922 region. From current levels, that would represent a potential upside of roughly 45%, aligning with typical expansion behavior seen after clean breakouts from this formation.
That said, patience remains key. Prior to confirmation, PENGU could still experience short-term pullbacks, including a possible retest of the 50-day moving average, which has now transitioned into dynamic support. Such retracements would not invalidate the bullish setup as long as higher-low structures continue to form.
Until a clear breakout and follow-through occur, caution is warranted. The $0.01294–$0.01381 zone remains the defining decision area that will determine whether PENGU transitions into a sustained bullish phase or continues consolidating as the early weeks of 2026 unfold.
Disclaimer: The views and analysis presented in this article are for informational purposes only and reflect the author’s perspective, not financial advice. Technical patterns and indicators discussed are subject to market volatility and may or may not yield the anticipated results. Investors are advised to exercise caution, conduct independent research, and make decisions aligned with their individual risk tolerance.
About Author: Nilesh Hembade is the Founder and Lead Author of Coinsprobe, with over 5 years of experience in the cryptocurrency and blockchain industry. Since launching Coinsprobe in 2023, he has been providing daily, research-driven insights through in-depth market analysis, on-chain data, and technical research.
Disclaimer: The information on this page may come from third parties and does not represent the views or opinions of Gate. The content displayed on this page is for reference only and does not constitute any financial, investment, or legal advice. Gate does not guarantee the accuracy or completeness of the information and shall not be liable for any losses arising from the use of this information. Virtual asset investments carry high risks and are subject to significant price volatility. You may lose all of your invested principal. Please fully understand the relevant risks and make prudent decisions based on your own financial situation and risk tolerance. For details, please refer to
Disclaimer.
Related Articles
Polkadot to Reset Tokenomics on March 12 With Major DOT Supply and Staking Changes
Polkadot will introduce a new monetary framework on March 12 that sets DOT’s supply cap at 2.1 billion and lowers emissions by 53.6%.
The overhaul will also create a Dynamic Allocation Pool and shorten the DOT unbonding period from 28 days to 24–48 hours.
On March 12, Polkadot will reset
CryptoNewsFlash2h ago
Bitcoin May Be Closer to a Bottom Than Most Think, Chart Signals
The Bitcoin price slipped about 2% today, trading slightly below $68,000 after pushing above $73,000 earlier this week, as already covered on our site. The move added fresh pressure to a market that still feels shaky, especially after several failed attempts to hold higher levels.
Still, not e
CaptainAltcoin3h ago
Dogecoin Monthly Breakdown Pattern Reappears as Price Tests $0.0918
Dogecoin is currently trading at $0.09205 at a gain of 2.3, with support of above $0.08878.
As can be seen in the monthly chart, there are recurring breakdown areas that have been followed by significant expansions in price.
The short-term trading range is narrow and the immediate point o
CryptoNewsLand3h ago
Solana Eyes $90.6 Trigger Point as $83 Support Holds and Liquidation Pressure Builds
A large cluster of short positions faces liquidation if SOL reaches $90.6, potentially increasing volatility.
SOL trades between $83.00 support and $89.58 resistance, keeping price action compressed in the short term.
SOL posts a 0.8% daily gain and rises 0.7% against BTC, holding
CryptoNewsLand3h ago
Crypto Market Plunges As Extreme Fear Controls Investor Sentiment
The global crypto market is notably bearish, with a 2.93% drop in market capitalization to $2.32T. Bitcoin and Ethereum saw decreases of 3.07% and 4.01%, respectively. Meanwhile, notable gainers include $XBTC, $TRUMP, and $PEPE. DeFi TVL and NFT sales also declined significantly, while key investments from YZi Labs and Kazakhstan's central bank emerged.
BlockChainReporter3h ago
HBAR at a Crossroads: Will $0.095 Support Trigger a Break Toward $0.106?
HBAR is trading at $0.09739 and above the S/R flip of $0.094-$0.096 in the 12H chart.
The nearest resistance will be at $0.10 with a falling trendline pressure at around $0.104-$0.106.
The support is at $0.095835 and a breakdown at the
CryptoNewsLand4h ago