
**Date: **Sat, Jan 03, 2026 | 01:26 PM GMT
As 2026 kicks off, the broader cryptocurrency market is showing renewed stability. Ethereum (ETH) has reclaimed the $3,100 level, and several major altcoins are already beginning to pick up momentum. Against this improving backdrop, Kaspa (KAS) is quietly positioning itself as a potential late mover, with its chart structure starting to flash early bullish signals.
While KAS is trading slightly in the red today and remains mostly flat on the weekly timeframe, the more important story is unfolding beneath the surface. Recent price action suggests a meaningful structural shift may be underway — one that could mark the early stages of a bullish continuation if confirmed.

Source: Coinmarketcap
Rounding Bottom in Play
On the 4-hour timeframe, Kaspa appears to be forming a rounding bottom pattern, a classic bullish reversal structure that typically develops after a prolonged corrective phase. This pattern reflects a slow but steady transition from distribution to accumulation, as selling pressure weakens and buyers gradually regain control.
The setup began after KAS faced strong rejection near the $0.06310 neckline zone, which triggered a sharp decline through late November and December. That downside move eventually found strong demand near the $0.040 level, which has since acted as a key support area. Multiple defenses of this zone prevented further downside and helped establish a stable base for a potential trend reversal.
Since carving out that bottom, KAS has started to curve higher in a smooth, rounded fashion — closely matching the textbook structure of a developing rounding bottom. The recent stabilization above the $0.045 region further supports the idea that downside momentum is fading.
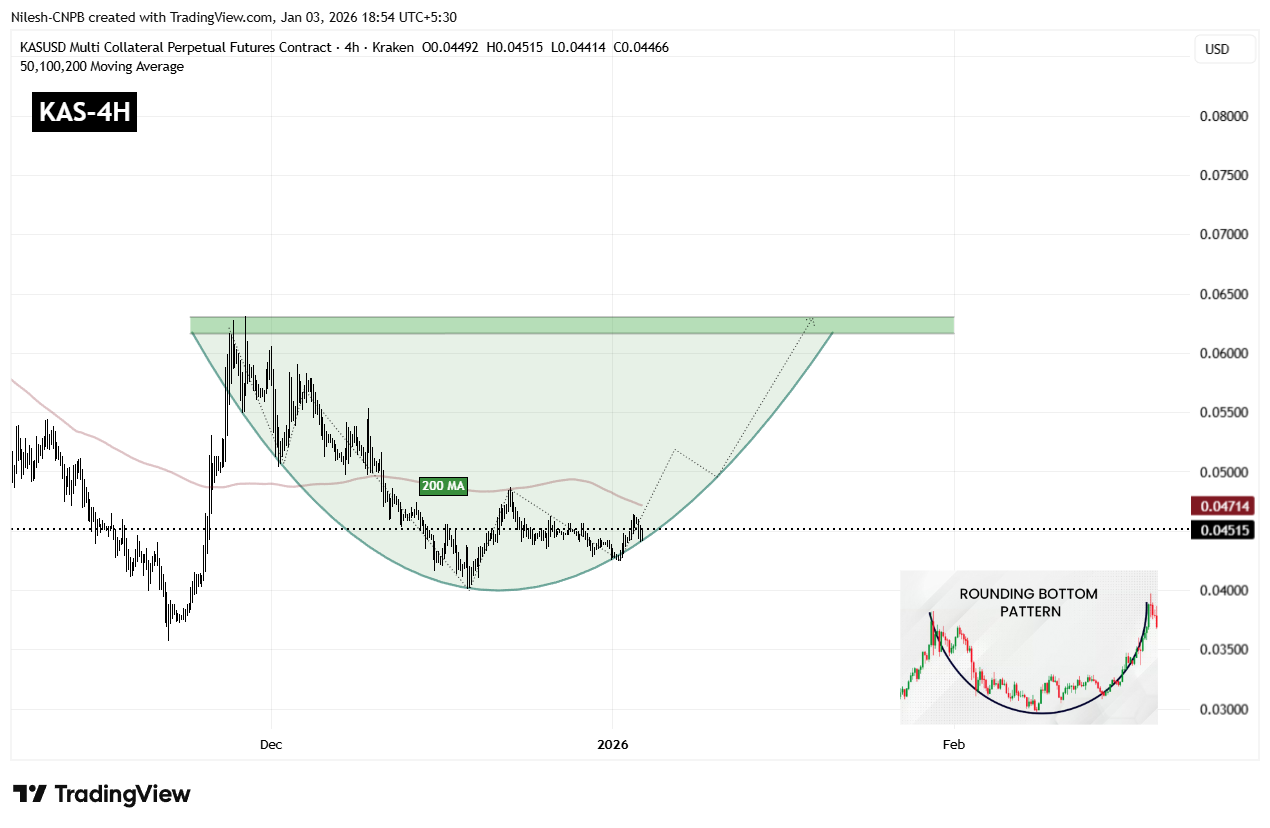
Kaspa (KAS) 4H Chart/Coinsprobe (Source: Tradingview)
A key technical level now comes into focus: the 200-period moving average, currently hovering near $0.04714. This level has acted as dynamic resistance during the recovery phase, and reclaiming it would mark an important shift in short-term market structure.
A sustained move above the 200 MA would indicate that buyers are regaining control after months of corrective price action and could act as the trigger for a stronger upside continuation.
What’s Next for KAS?
For full confirmation of the rounding bottom pattern, KAS must eventually reclaim the $0.06310 neckline resistance. A clean breakout above this zone would validate the entire reversal structure and could open the door to a broader bullish expansion phase, with momentum traders likely re-entering the market.
Until that breakout occurs, the pattern remains in development. Short-term consolidation or shallow pullbacks remain possible, especially near moving average resistance. However, as long as price continues to hold above the $0.04245 support base and maintains higher lows, the broader bottoming structure remains intact and constructive.
In the near term, all eyes remain on the 200 MA and the neckline zone. How Kaspa reacts around these levels will likely determine whether this emerging bullish setup evolves into a confirmed breakout move or requires more time to mature.
Disclaimer: The views and analysis presented in this article are for informational purposes only and reflect the author’s perspective, not financial advice. Technical patterns and indicators discussed are subject to market volatility and may or may not yield the anticipated results. Investors are advised to exercise caution, conduct independent research, and make decisions aligned with their individual risk tolerance.
About Author: Nilesh Hembade is the Founder and Lead Author of Coinsprobe, with over 5 years of experience in the cryptocurrency and blockchain industry. Since launching Coinsprobe in 2023, he has been providing daily, research-driven insights through in-depth market analysis, on-chain data, and technical research.
Disclaimer: The information on this page may come from third parties and does not represent the views or opinions of Gate. The content displayed on this page is for reference only and does not constitute any financial, investment, or legal advice. Gate does not guarantee the accuracy or completeness of the information and shall not be liable for any losses arising from the use of this information. Virtual asset investments carry high risks and are subject to significant price volatility. You may lose all of your invested principal. Please fully understand the relevant risks and make prudent decisions based on your own financial situation and risk tolerance. For details, please refer to
Disclaimer.
Related Articles
Oil prices rise to $119, reaching a new high since 2022, Bitcoin remains at $67,000, and the Federal Reserve has a 99% probability of maintaining interest rates in March.
On March 9th, WTI crude oil prices rose to $119 per barrel, reaching a new high since 2022. Due to threats from Iran, global crude oil supply losses approached 20 million barrels. Bitcoin remained at $67,000, with no signs of panic selling. The probability that the Federal Reserve will keep interest rates unchanged is approximately 99%.
GateNews23m ago
Bitcoin order book data: Over $100 million in buy orders accumulated in the $65,000 range, with sell pressure around $68,000.
Gate News Report, March 9 — On the X platform, on-chain data analysis platform Coinglass released data showing that Bitcoin order books have accumulated buy orders exceeding $100 million in the $65,000 to $65,150 range. Meanwhile, order book data indicates significant sell pressure around the $68,000 level.
GateNews25m ago
Bitcoin short-term holder SOPR indicator was below 1.0 for 7 out of 8 days, with a supply decrease of 140,000 coins over two weeks.
The report shows that the SOPR indicator for short-term Bitcoin holders has been below 1 for 7 out of the past 8 days, indicating they are selling below cost. Additionally, the supply has decreased to 5.92 million BTC, reflecting realized losses or a shift to long-term holding.
GateNews44m ago
Shiba Inu Sees 157B Token Inflows as Selling Pressure Intensifies
Key Insights
Over 157 billion SHIB tokens moved to exchanges within 24 hours, signaling increased selling activity and raising concerns about renewed market supply pressure.
Shiba Inu trades near $0.0000055 while remaining below major moving averages, confirming that the broader market
CryptoFrontNews1h ago
Wall Street Expert Warns of 35% Stock Crash Amid US-Iran War
Ed Yardeni predicts a 35% crash in U.S. and crypto stocks amid escalating tensions in the U.S.-Iran war, with rising oil prices and changing investor sentiment. Crypto firms are adjusting strategies as the economic outlook becomes more uncertain.
TheNewsCrypto1h ago
Crypto Market Signals Recovery Despite Persistent Fear
The global crypto market shows signs of recovery, with a 0.58% increase in market cap to $2.31T and a 42.79% rise in trading volume. Bitcoin and Ethereum have both seen modest gains, while top gainers include Black Phoenix and PENGU AI. DeFi TVL dipped slightly, but NFT sales rose significantly. Key developments include concerns from an actor about Bitcoin's future and new initiatives in crypto mining from space.
BlockChainReporter1h ago