
Date: Sat, Jan 03, 2026 | 06:50 PM GMT
As 2026 kicks off, the broader cryptocurrency market is showing renewed stability. Ethereum (ETH) has reclaimed the $3,100 mark, and momentum is gradually spreading across major altcoins — including Bittensor (TAO).
TAO is trading around 3% higher on the day, extending its weekly gains to nearly 14%. While the short-term strength is encouraging, the more important development lies in the structure forming on the chart. Recent price action suggests a meaningful shift in market behavior — one that could signal the early stages of a bullish continuation if key levels are reclaimed.
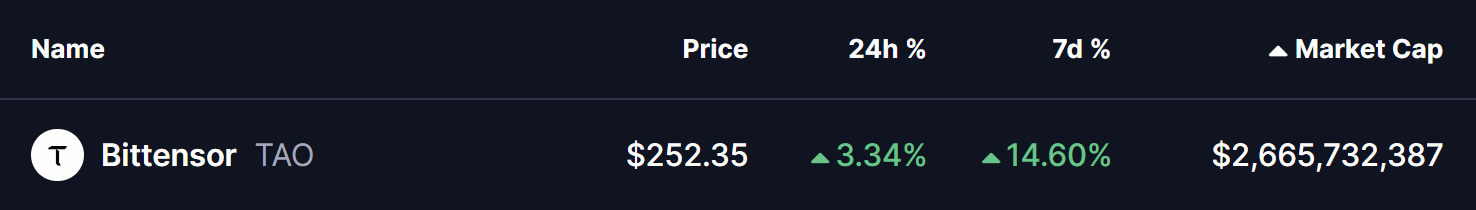
Source: Coinmarketcap
Rounding Bottom Pattern Takes Shape
On the 4-hour timeframe, Bittensor appears to be forming a rounding bottom pattern, a classic bullish reversal structure that typically develops after an extended corrective phase. This pattern reflects a gradual transition from distribution to accumulation, where selling pressure fades and buyers begin to step in more consistently.
The setup began after TAO faced a firm rejection near the $315 neckline resistance, which triggered a sharp decline through late November and December. That move eventually found strong demand near the $206 support zone, where selling momentum stalled. Multiple defenses of this level prevented any deeper breakdown and helped establish a solid base for a potential trend reversal.
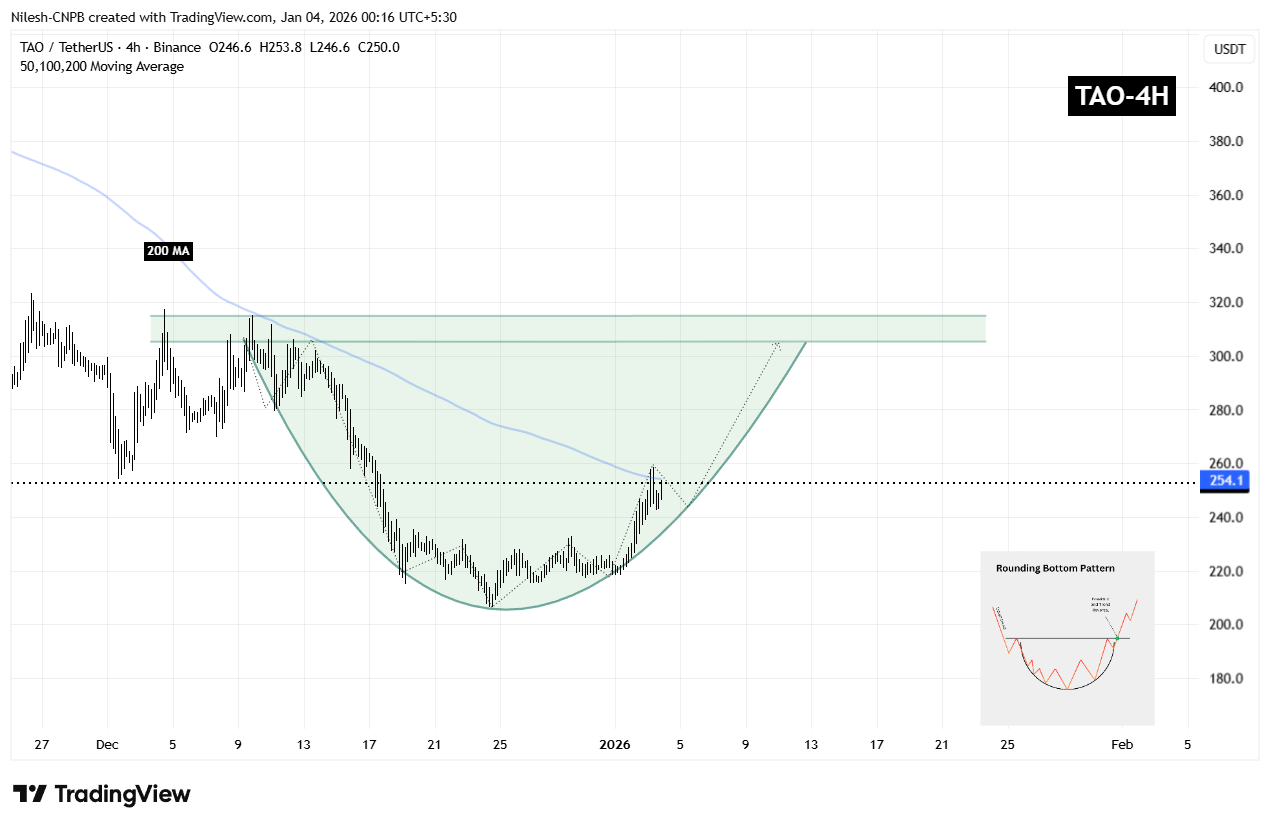
Bittensor (TAO) 4H Chart/Coinsprobe (Source: Tradingview)
Since carving out that bottom, TAO has started to curve higher in a smooth, rounded fashion — closely matching the textbook structure of a developing rounding bottom. The recent recovery has also brought price back toward the 200-period moving average near $254, a level that previously acted as resistance and is now being tested as potential support.
What’s Next for TAO?
If TAO manages to hold above the 200 MA, that level could act as short-term support and provide a foundation for further upside attempts. A clean breakout above the $315 resistance zone, followed by sustained acceptance above it, would validate the entire reversal structure and likely open the door for a broader bullish expansion phase, with momentum traders re-entering the market.
Until that breakout occurs, the pattern remains in development. Short-term consolidation or shallow pullbacks remain possible, particularly as price digests recent gains. However, as long as TAO continues to maintain higher lows above the established base, the broader bottoming structure remains intact and constructive.
For now, the chart suggests that TAO is approaching a critical confirmation phase — one that could determine whether this recovery evolves into a sustained bullish trend as the new year unfolds.
Disclaimer: The views and analysis presented in this article are for informational purposes only and reflect the author’s perspective, not financial advice. Technical patterns and indicators discussed are subject to market volatility and may or may not yield the anticipated results. Investors are advised to exercise caution, conduct independent research, and make decisions aligned with their individual risk tolerance.
About Author: Nilesh Hembade is the Founder and Lead Author of Coinsprobe, with over 5 years of experience in the cryptocurrency and blockchain industry. Since launching Coinsprobe in 2023, he has been providing daily, research-driven insights through in-depth market analysis, on-chain data, and technical research.
Disclaimer: The information on this page may come from third parties and does not represent the views or opinions of Gate. The content displayed on this page is for reference only and does not constitute any financial, investment, or legal advice. Gate does not guarantee the accuracy or completeness of the information and shall not be liable for any losses arising from the use of this information. Virtual asset investments carry high risks and are subject to significant price volatility. You may lose all of your invested principal. Please fully understand the relevant risks and make prudent decisions based on your own financial situation and risk tolerance. For details, please refer to
Disclaimer.
Related Articles
Solana Eyes $90.6 Trigger Point as $83 Support Holds and Liquidation Pressure Builds
A large cluster of short positions faces liquidation if SOL reaches $90.6, potentially increasing volatility.
SOL trades between $83.00 support and $89.58 resistance, keeping price action compressed in the short term.
SOL posts a 0.8% daily gain and rises 0.7% against BTC, holding
CryptoNewsLand5m ago
Crypto Market Plunges As Extreme Fear Controls Investor Sentiment
The global crypto market is notably bearish, with a 2.93% drop in market capitalization to $2.32T. Bitcoin and Ethereum saw decreases of 3.07% and 4.01%, respectively. Meanwhile, notable gainers include $XBTC, $TRUMP, and $PEPE. DeFi TVL and NFT sales also declined significantly, while key investments from YZi Labs and Kazakhstan's central bank emerged.
BlockChainReporter34m ago
HBAR at a Crossroads: Will $0.095 Support Trigger a Break Toward $0.106?
HBAR is trading at $0.09739 and above the S/R flip of $0.094-$0.096 in the 12H chart.
The nearest resistance will be at $0.10 with a falling trendline pressure at around $0.104-$0.106.
The support is at $0.095835 and a breakdown at the
CryptoNewsLand55m ago
DXY Retest at 99.183: Will 100–101 Break as US Degen Index Stabilizes?
DXY trades at 99.183 while retesting the 100–101 monthly resistance zone.
US Degen Index 6900 sits at $0.0001197 with support at $0.0001175 and resistance at $0.0001214.
A break above 101 on DXY would shift structure higher, while rejection keeps price below key resistance.
The U.
CryptoNewsLand58m ago
PEPE Hovers at Critical $0.053414 Support as $432M Volume Surge Tightens Breakout Watch
PEPE is trading at $0.053416, just above support at $0.053414, with significant trading volume up 22.14%. Resistance is at $0.053676. Despite a slight decrease in price, there’s increased market activity, suggesting potential volatility.
CryptoNewsLand1h ago
Expert Claims Altcoin Metrics Are Being 'Gamed' to Mislead Investors
Crypto researcher Orbion raises concerns over the possible manipulation of key market indicators, including the Altseason Index and Crypto Fear and Greed Index, suggesting that inflated metrics create false optimism and mislead investors about the onset of altcoin season.
Coinpedia1h ago