XRP remains range-bound around $2.06, with Elliott Wave theory awaiting Wave B confirmation. The yellow path indicates an upward trend, while the orange path suggests a correction. Resistance is at $2.17-$2.33, support at $1.96. Decreasing volume and neutral RSI reflect hesitation, and Wave B will determine the next 50% trend direction.
Wave B confirmation marks the watershed for XRP’s movement
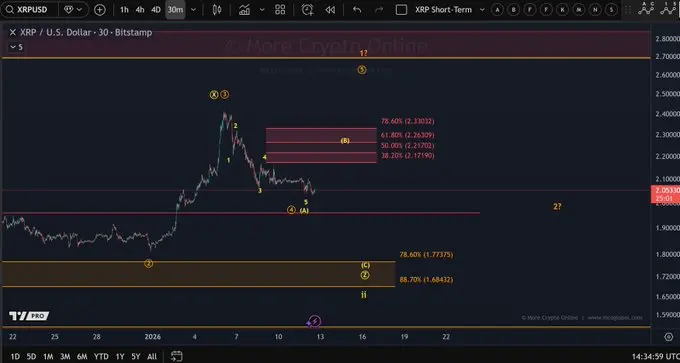
(Source: Trading View)
XRP continues to fluctuate within a narrow range, lacking momentum. A recent article on More Crypto Online describes the current price action as “deadly dull,” reflecting low volatility and waning trader confidence. The analysis uses Elliott Wave theory to explain this stagnation, suggesting the market is waiting for Wave B to begin. The upcoming movement will clarify whether XRP is preparing for another rally or entering a deeper correction phase.
Elliott Wave theory is a classic technical analysis tool used to forecast market cycles. It posits that markets move in five-wave upward and three-wave corrective patterns. Currently, XRP may be in the prelude to a Wave B within an ABC correction. Wave B is typically a rebound within the correction, and its magnitude and duration will determine the depth of the entire correction. A strong Wave B could signal the correction is ending, with subsequent Wave C limited in decline, possibly only 20-30%.
Conversely, if Wave B is weak, only rebounding near $2.17 with strong resistance, it may indicate market lack of confidence, and Wave C could be more severe, testing support at $1.70 or lower. Historically, the strength of Wave B often depends on fundamental catalysts. If XRP receives significant positive news during this period, such as large ETF inflows or major commercial breakthroughs by Ripple, Wave B could evolve into the start of a new rally.
Currently, Wave B has not yet appeared, so both scenarios remain possible. This uncertainty is at the core of the current market “deadness”: traders are unsure whether to go long or short, and most prefer to wait and see. Therefore, traders remain cautious rather than making definitive directional bets. Only when Wave B truly emerges and shows strength can the market confirm its primary direction.
Yellow path versus orange path: the ultimate showdown
The analysis outlines two competing Elliott Wave scenarios, called the yellow path and the orange path. The yellow path assumes XRP is consolidating and ready to resume upward movement, with the current sideways action building momentum for the next rally. Once Wave B confirms and breaks through resistance at $2.17, a rapid rise to $2.50-$3.00 could occur, representing a 20-45% increase from current levels. If it further breaks $3.00, the yellow path suggests gains of 50% or more.
In contrast, the orange path indicates the market remains in a correction structure, which could limit short-term upside. In this scenario, even if Wave B rebounds, it would be a technical correction, likely stalling at $2.17-$2.20 before Wave C declines. The subsequent Wave C could push the price down to support at $1.96, and if that support fails, further declines to $1.70 or even $1.50 are possible, representing a 27-30% drop from current levels.
The key difference lies in the fundamental market structure judgment. The yellow path believes that the correction from the $3.66 high to the current $2.06 has been a healthy retracement, and the market is ready to resume its upward trend. The orange path suggests the correction is incomplete, requiring a deeper shakeout to clear out weak hands and prepare for a genuine bull market.
The technical significance of resistance at $2.17 and support at $1.96
From a technical perspective, resistance remains a prominent feature on XRP’s chart. Analysis shows resistance between $2.17 and $2.33, aligning with Fibonacci retracement levels commonly used in Elliott Wave analysis. The $2.17 level corresponds approximately to the 38.2% retracement, and $2.33 is near the 50% retracement. These levels often serve as decision zones during corrections, where bulls and bears clash.
On the downside, support around $1.96 remains effective, preventing further declines. This support has repeatedly provided buying interest during dips, indicating many investors see $1.96 as a reasonable entry point. Currently, the price hovers around $2.06, right in the middle of support and resistance, reflecting a market in balance rather than a clear trend.
XRP’s sideways movement, declining volume, and lack of active buying or selling align with this. This phenomenon suggests both retail and short-term traders are waiting for confirmation signals before committing funds. Unlike momentum-driven phases, the current market structure favors patience over aggressive positioning. The shrinking volume is a clear sign of market participants observing rather than acting. Such low-volume consolidation often precedes a breakout, as markets tend not to stay in equilibrium indefinitely.
Looking ahead, traders focus on the emergence of Wave B. A decisive break above $2.17 would reinforce a bullish trend, indicating demand recovery and making the yellow path the dominant scenario. Conversely, failure to hold support at $1.96 would increase the likelihood of a correction, confirming the orange path. Until confirmation signals appear, XRP is likely to continue oscillating within the range.
Disclaimer: The information on this page may come from third parties and does not represent the views or opinions of Gate. The content displayed on this page is for reference only and does not constitute any financial, investment, or legal advice. Gate does not guarantee the accuracy or completeness of the information and shall not be liable for any losses arising from the use of this information. Virtual asset investments carry high risks and are subject to significant price volatility. You may lose all of your invested principal. Please fully understand the relevant risks and make prudent decisions based on your own financial situation and risk tolerance. For details, please refer to
Disclaimer.
Related Articles
Will XRP Hold $1.33 or Extend Toward $1.30 Before Rebound?
XRP is currently trading at $1.35, experiencing a 1.3% decline. Key support is at $1.34, while resistance is at $1.40. The price is testing around the Fibonacci levels of $1.33 and $1.30, crucial for potential upward movement or deeper decline.
CryptoNewsLand27m ago
Dogecoin Monthly Breakdown Pattern Reappears as Price Tests $0.0918
Dogecoin is currently trading at $0.09205 at a gain of 2.3, with support of above $0.08878.
As can be seen in the monthly chart, there are recurring breakdown areas that have been followed by significant expansions in price.
The short-term trading range is narrow and the immediate point o
CryptoNewsLand30m ago
Solana Nears $95 Resistance With $17B Volume Surge
Solana approaches a key resistance level near $95, with increased trading volume and open interest signaling active trader interest. The token is currently at $90.20, facing potential upward movement if it surpasses $95, but may test $85 if rejected.
CryptoFrontNews56m ago
Bitcoin Slips to $68,000 as Middle East Conflict and US Jobs Data Trigger Sell-Off
Bitcoin surrendered its $70,000 support level, triggering a broader crypto market retreat that wiped out $329 million in leveraged positions. This downturn was fueled by a perfect storm of geopolitical and macroeconomic pressures.
Wiping out the ‘War Gains’
Bitcoin’s midweek resilience
Coinpedia56m ago
PEPE Hovers at Critical $0.053414 Support as $432M Volume Surge Tightens Breakout Watch
PEPE is trading at $0.053416, just above support at $0.053414, with significant trading volume up 22.14%. Resistance is at $0.053676. Despite a slight decrease in price, there’s increased market activity, suggesting potential volatility.
CryptoNewsLand1h ago
DXY Retest at 99.183: Will 100–101 Break as US Degen Index Stabilizes?
DXY trades at 99.183 while retesting the 100–101 monthly resistance zone.
US Degen Index 6900 sits at $0.0001197 with support at $0.0001175 and resistance at $0.0001214.
A break above 101 on DXY would shift structure higher, while rejection keeps price below key resistance.
The U.
CryptoNewsLand1h ago