
**Date: **Wed, Jan 07, 2026 | 08:00 AM GMT
The broader cryptocurrency market continues to show strong New Year momentum, with Bitcoin (BTC) up nearly 4% and Ethereum (ETH) posting weekly gains of over 9%. This improving risk sentiment is now extending beyond majors and into select altcoins — including Pudgy Penguins (PENGU).
PENGU has already delivered an impressive 45% gain over the past week. While the rally itself is notable, the more important development lies in the underlying market structure. Recent price behavior on the daily chart suggests that PENGU may be approaching a pivotal breakout zone, one that could define the next directional move.
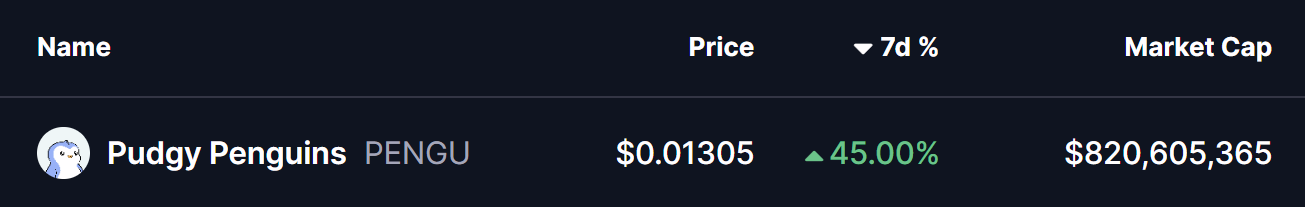
Source: Coinmarketcap
Right-Angled Descending Broadening Pattern in Play
On the daily timeframe, PENGU had been trading within a right-angled descending broadening formation — a bullish reversal pattern characterized by repeated rejections at a flat resistance level and gradually rising downside volatility.
For several weeks, price remained capped beneath the $0.01294–$0.01381 resistance band. Each attempt to push higher was met with selling pressure, keeping PENGU locked in consolidation while the lower boundary of the structure continued to expand.
That dynamic changed after a strong rebound from the lower trendline. Buyers stepped in decisively, triggering a sharp upside move that allowed PENGU to reclaim the 50-day moving average around $0.01062. This level had previously acted as persistent dynamic resistance, and reclaiming it marked a clear shift in short-term momentum.
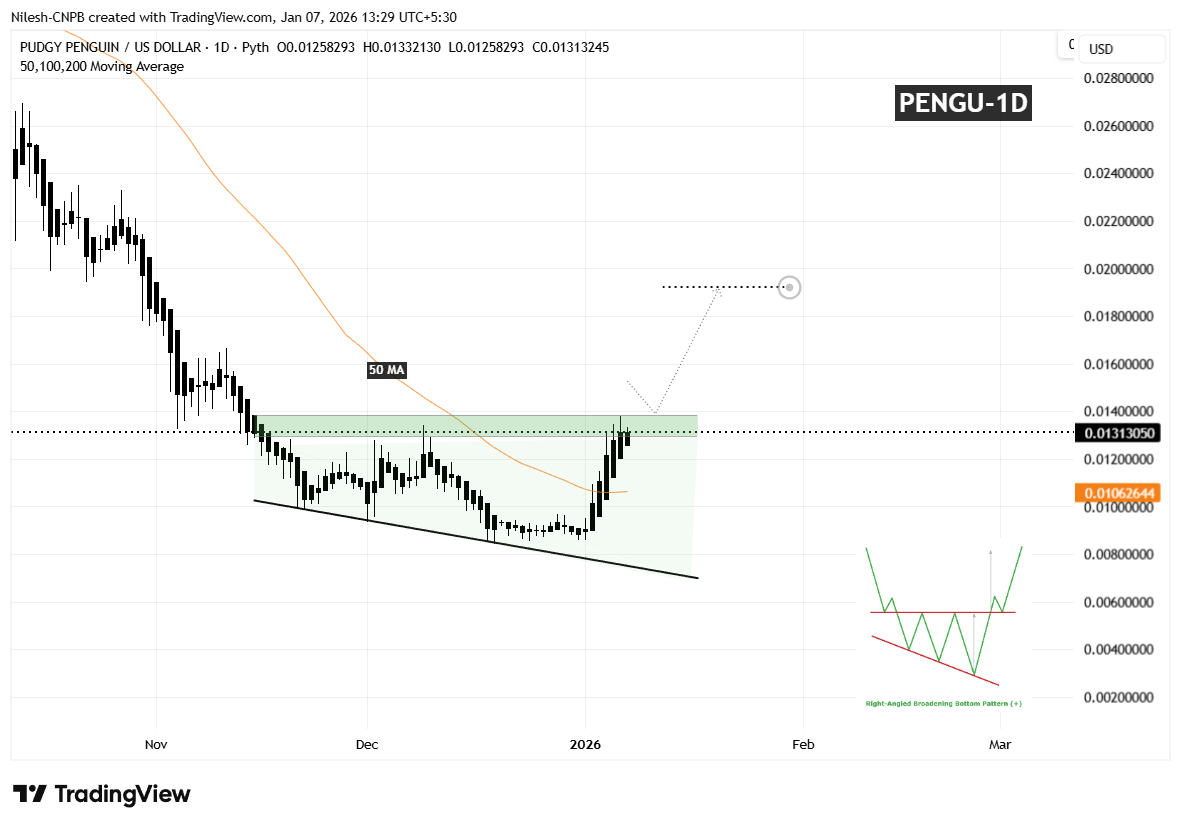
Pudgy Penguins (PENGU) Daily Chart/Coinsprobe (Source: Tradingview)
Following this reclaim, upside strength accelerated, and price has now returned to the same resistance zone that rejected advances multiple times in the past. This move back into resistance places PENGU at a critical inflection point, where market participants are once again being tested.
What’s Next for PENGU?
A decisive daily close above the $0.01294–$0.01381 resistance area would confirm a breakout from the descending broadening formation and validate the broader bullish reversal setup. Sustained acceptance above this zone would likely invite fresh momentum participation, as traders recognize the structural shift underway.
Based on the depth of the pattern and its measured move projection, a successful breakout could open the door toward the $0.01922 region. From current levels, that would represent a potential upside of roughly 45%, aligning with typical expansion behavior seen after clean breakouts from this formation.
That said, patience remains key. Prior to confirmation, PENGU could still experience short-term pullbacks, including a possible retest of the 50-day moving average, which has now transitioned into dynamic support. Such retracements would not invalidate the bullish setup as long as higher-low structures continue to form.
Until a clear breakout and follow-through occur, caution is warranted. The $0.01294–$0.01381 zone remains the defining decision area that will determine whether PENGU transitions into a sustained bullish phase or continues consolidating as the early weeks of 2026 unfold.
Disclaimer: The views and analysis presented in this article are for informational purposes only and reflect the author’s perspective, not financial advice. Technical patterns and indicators discussed are subject to market volatility and may or may not yield the anticipated results. Investors are advised to exercise caution, conduct independent research, and make decisions aligned with their individual risk tolerance.
About Author: Nilesh Hembade is the Founder and Lead Author of Coinsprobe, with over 5 years of experience in the cryptocurrency and blockchain industry. Since launching Coinsprobe in 2023, he has been providing daily, research-driven insights through in-depth market analysis, on-chain data, and technical research.
Disclaimer: The information on this page may come from third parties and does not represent the views or opinions of Gate. The content displayed on this page is for reference only and does not constitute any financial, investment, or legal advice. Gate does not guarantee the accuracy or completeness of the information and shall not be liable for any losses arising from the use of this information. Virtual asset investments carry high risks and are subject to significant price volatility. You may lose all of your invested principal. Please fully understand the relevant risks and make prudent decisions based on your own financial situation and risk tolerance. For details, please refer to
Disclaimer.
Related Articles
Aster Price Nears $0.79 Breakout as Reversal Pattern Strengthens
Key Insights
Aster price structure shows an inverse head and shoulders pattern forming beneath $0.79 resistance, signaling growing buying pressure and possible trend reversal ahead.
Repeated tests of the $0.79 neckline suggest weakening selling pressure as buyers steadily absorb supply
CryptoFrontNews29m ago
The HYPE price could surge despite the upcoming $2.8 million short squeeze.
The recent price movements of Hyperliquid (HYPE) are characterized by stagnation around 30 USD. A symmetrical triangle pattern indicates potential for a breakout in either direction, but market sentiment is cautious. Short squeeze risks may boost prices, while weak market flow and deteriorating demand pose challenges. The token could face significant support levels if it dips below 30 USD. An improved market sentiment could lead to a breakout above 33 USD, sparking recovery momentum.
TapChiBitcoin42m ago
Ethereum Price Holds Key Support: Is $2,200 the Next Test for ETH?
March 6, 2026 7:15 pm EST
TheCoinRepublic2h ago
Cardano Price Trends: Bulls Eye Opportunity as Indicator Flashes Green
ADA: Trading near $0.27, facing resistance at $0.28 and support at $0.26.
Technical Indicators: RSI and MACD show weak momentum, signaling short-term consolidation and cautious trading.
Macro Outlook: Rising PMI and historical patterns suggest potential bullish rebound if resistance
CryptoNewsLand3h ago
CryptoQuant: Bitcoin NUPL--MVRV indicator reaches 0.33, or has entered the mid-stage of a bear market
Gate News Announcement, March 7th, CryptoQuant analyst Axel pointed out on the X platform that the Bitcoin NUPL--MVRV harmonic composite indicator has reached 0.33, while historical cycle bottoms typically occur around the 0.5 range. The chart shows that the bear market cycle is beginning to shift upward, indicating that Bitcoin may have entered the mid-stage of this bear market cycle, suggesting that extreme selling conditions are easing. However, this indicator is still well above historical bottom levels, implying that a market-wide bottom has not yet been confirmed.
GateNews3h ago
ZEC Price Analysis: Upcoming Trends and Targets for the Next Few Weeks
ZEC: Stabilized near $200 support, rebounding toward $250 resistance after prolonged bearish pressure.
Technical Indicators: RSI and MACD show gradual improvement, signaling moderate bullish momentum returning.
Market Outlook: Sustained above $240 could push ZEC toward $268, while
CryptoNewsLand4h ago