The SUI price is back on traders’ radars after holding a key higher-timeframe support zone and bouncing sharply from recent lows. According to CryptoPatel, the weekly chart is starting to show signs of re-accumulation after a deep correction from the 2024 highs.
While price has already moved higher, the broader setup indicates this could be the early phase of a larger trend shift. At the time of the analysis, the SUI price was hovering around the $1.80 area, already up roughly 45% from the recent low.
- What the SUI Chart Is Telling Us
- Structure and Momentum Check
- Where SUI Price Could Head Next
What the SUI Chart Is Telling Us
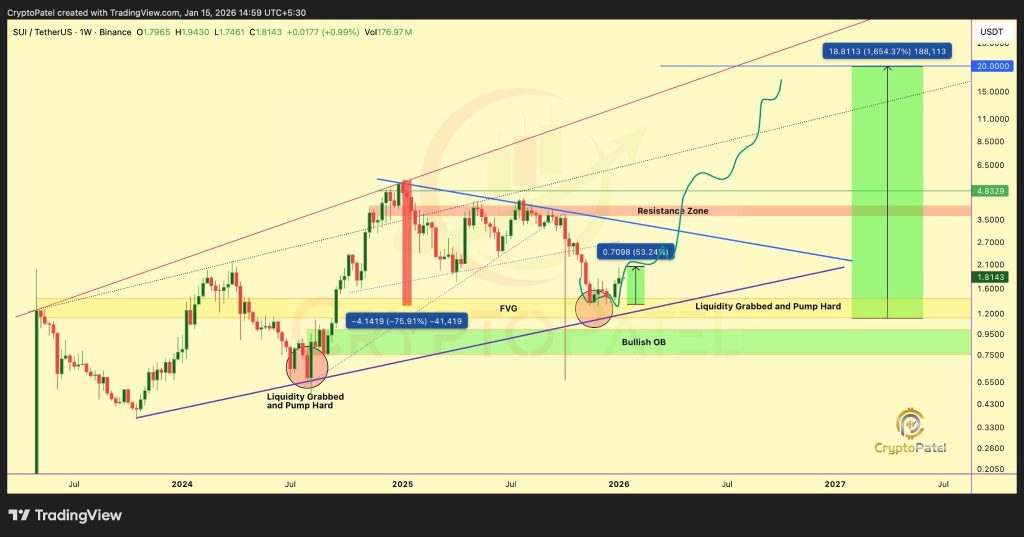
On the weekly chart shared by Patel, the SUI price completed a clear liquidity sweep below previous lows. That move flushed out weaker hands before price quickly reversed, a pattern that often points to smarter positioning behind the scenes. The rebound started inside a strong weekly bullish order block between $1.30 and $1.50, a zone that price respected cleanly.
Source: X/@CryptoPatel
What makes this area stand out even more is that it lines up with a fair value gap. That overlap created a strong demand zone, and once price tapped into it, buyers stepped in fast. Since then, the SUI price has been pushing higher, supporting the idea that the market is moving from distribution into re-accumulation.
SUI Short-Term Outlook: Where Could Price Be Headed Next?_**
Structure and Momentum Check
Zooming out, it is clear that SUI is still trading in a rising channel. Despite the recent pullback from 2024 highs, a look at a larger picture indicates that a rising channel is still in play. Instead of a breakdown, a correction in price started right where it mattered.
The nearly 50% bounce from the demand zone shows that downside momentum has eased. As long as the SUI price holds above $1.20 on a weekly close, the bullish structure stays in place. That level now acts as the line in the sand for the bigger picture.
Where SUI Price Could Head Next
CryptoPatel points to upside targets at $5, $10, and even $20, based on the channel structure and historical expansion levels. These moves would not happen in a straight line, but the setup suggests higher prices remain possible if accumulation continues.
For now, the attention is on whether the SUI price can continue to make higher lows and remain above support levels. If so, a correction would only mean a continuation of a correction, and all possibilities are very much alive.
Disclaimer: The information on this page may come from third parties and does not represent the views or opinions of Gate. The content displayed on this page is for reference only and does not constitute any financial, investment, or legal advice. Gate does not guarantee the accuracy or completeness of the information and shall not be liable for any losses arising from the use of this information. Virtual asset investments carry high risks and are subject to significant price volatility. You may lose all of your invested principal. Please fully understand the relevant risks and make prudent decisions based on your own financial situation and risk tolerance. For details, please refer to
Disclaimer.
Related Articles
Pi Network price hits two-week high, protocol upgrade drives 8.5% increase
Pi Network's native token PI rose about 8.5% on March 4th, reaching a nearly two-week high, following the successful upgrade to protocol v19.9. The upgrade aims to strengthen network capabilities and will introduce v20.2 before Pi Day 2026. Despite the short-term increase, the Pi Foundation transferred 60.99 million tokens, which could trigger supply pressure. Technically, PI faces a key resistance level at $0.173.
MarketWhisper3m ago
Gate Institute: Under wartime conditions, BTC's trend remains stable with a slight upward bias, and volatility stays high
According to observations from the Gate Research Institute, the current implied volatility for Bitcoin (BTC) and Ethereum (ETH) are 55% and 74%, respectively, reflecting the options market's high expectations for short-term price fluctuations. Recent negative Delta skew for BTC and ETH indicates increased demand for short-term puts. The Gamma distribution is concentrated around March 13, which could lead to amplified volatility. In terms of large options trades, significant buying activity has been observed for both BTC and ETH.
GateNews9m ago
Bitcoin surges past $74,000! Korean stocks plunge 20% over two days, retail investors returning to crypto becoming a rebound driver?
Bitcoin recently broke through $74,000 and attracted $680 million in ETF inflows within two days, as a sharp decline in Korean stocks prompted retail investors to move funds into the crypto market. Although the market remains optimistic, some experts warn of potential bull trap scenarios and advise caution. Overall, opinions on Bitcoin's upward trend remain divided.
CryptoCity11m ago
Ethereum (ETH) recovers with record OI: What is the market expecting?
Ethereum (ETH) broke above the $2,100 mark during Thursday's trading session, riding the wave of recovery spreading across the cryptocurrency market.
The rally of the largest altcoin in the market is accompanied by a surge in open interest (OI), which now stands at 13.43 million ETH — the highest since January 31.
TapChiBitcoin14m ago
XRP Today News: Ripple Implements AI-Driven Secure Ledger, Upgrades Security After Vulnerability Exposure
Ripple engineers have discovered a security vulnerability in the XRP Ledger's batch transaction processing mechanism, prompting the team to intervene to prevent impact. To enhance security, Ripple will integrate AI tools into the development process, covering code review and simulated attack testing, strengthening defenses to reduce future risks. Additionally, the current technical support and resistance levels for XRP are around $1.50; a breakout above this level could point to higher targets.
MarketWhisper32m ago
HBAR Faces Renewed Pressure as $0.09 Support Weakens
Key Insights:
HBAR price repeatedly failed to clear value area high resistance, reinforcing overhead supply and weakening bullish momentum within the current range structure.
The $0.09 high timeframe support now defines short term direction as price rotates lower inside a clearly
CryptoFrontNews46m ago