Kaspa is trading around $0.044 at press time, sitting right on the level that mattered most in last week’s outlook. In our previous Kaspa price prediction, the focus was clear: as long as the KAS price held the $0.044–$0.045 support zone, downside risk stayed limited and the structure remained constructive.
That scenario played out almost perfectly. Kaspa briefly rallied toward $0.050 during the middle of the week, confirming that buyers are still active on dips. However, the move lacked follow-through, and price has since pulled back into its familiar range. This keeps the short-term question unchanged: does Kaspa defend support again, or does selling pressure finally push it lower?
- Factors That Could Shape the Kaspa Price
- Kaspa Chart Analysis
- Kaspa Price Prediction for This Week
Factors That Could Shape the Kaspa Price
One of the biggest structural themes for Kaspa remains its emission schedule. By July 2026, roughly 95% of KAS’s 28.7 billion maximum supply will already be mined. Miner rewards currently sit near 55 KAS per block, but emissions continue to fall by about 5% every month.
What this means for the KAS price is straightforward. Reduced emissions gradually lower sell pressure from miners, which can help stabilize the market over time. However, the mining landscape is becoming increasingly ASIC-dominated, with the network’s hash rate hovering around 210 EH/s. That raises centralization concerns and ties mining profitability closely to price. For many miners, KAS needs to stay above $0.04 to remain economically viable once energy costs are factored in.
On the ecosystem side, Kaspa recently launched K-Social, a decentralized social platform built directly on its blockchain. Posts, profiles, and interactions are stored on-chain, with microtransaction costs measured in fractions of a cent. While this won’t move the Kaspa price overnight, it reinforces Kaspa’s narrative as a fast, low-cost network focused on real on-chain activity rather than speculation alone.
Kaspa Chart Analysis
We had a look at the KAS chart, and Kaspa remains stuck in a broad consolidation that has defined most of December and January.
Support sits firmly in the $0.044–$0.045 zone. This area has been tested multiple times and continues to attract buyers. A clean break below $0.044 would expose the next downside area near $0.040, which marks the prior local low.
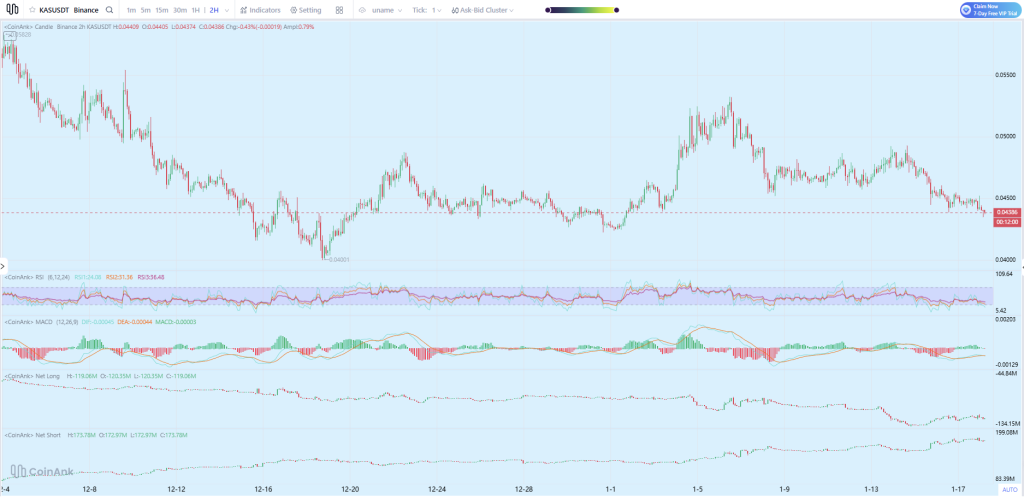
Source: CoinAnk
On the upside, resistance remains layered. The first barrier comes in around $0.048–$0.050, where last week’s rally stalled. A decisive move above $0.050 would shift short-term momentum and open the door toward $0.055, though that would likely require broader market strength.
Momentum indicators show the range-bound environment. RSI is sitting in neutral territory, neither oversold nor overbought, which fits the sideways price action. MACD remains flat, with no strong bullish or bearish crossover, indicating a lack of conviction from either side.
Positioning data adds an interesting layer. Net longs have gradually declined, while net shorts continue to build. This indicates growing bearish bets, which can increase volatility if price suddenly moves higher and forces short covering. For now, though, shorts appear comfortable as long as the KAS price stays capped below resistance.
Read also: Kaspa and Zcash in Talks? Why This Privacy-Speed Crossover Has the Community Excited
Kaspa Price Prediction for This Week
In the short term,
cautious but stable.
As long as $0.044 holds, Kaspa is likely to continue chopping inside its established range, with potential rebounds toward $0.048–$0.050. A daily close below $0.044 would weaken the structure and raise the risk of a move toward $0.040.
On the flip side, a sustained break above $0.050 would mark a clear shift in momentum and could quickly pull the Kaspa price into the mid-$0.05 area. Until that happens, patience is key.
For now, Kaspa remains a market defined by compression rather than direction. The next meaningful move will likely come only once price escapes this range and forces both longs and shorts to reposition.
Read also: How Much Will 100,000 Kaspa (KAS) Be Worth in 2027?
Disclaimer: The information on this page may come from third parties and does not represent the views or opinions of Gate. The content displayed on this page is for reference only and does not constitute any financial, investment, or legal advice. Gate does not guarantee the accuracy or completeness of the information and shall not be liable for any losses arising from the use of this information. Virtual asset investments carry high risks and are subject to significant price volatility. You may lose all of your invested principal. Please fully understand the relevant risks and make prudent decisions based on your own financial situation and risk tolerance. For details, please refer to
Disclaimer.
Related Articles
PEPE Price Coils Within $0.053385–$0.053517 Band as Momentum Stays Balanced
PEPE is trading within a tight range, with support at $0.053385 and resistance at $0.053517. The token shows minimal daily gains and balanced momentum indicators, indicating potential for volatility. Despite limited movement against USDT, PEPE appreciates against BTC and ETH.
CryptoNewsLand14m ago
1.7 Billion Cardano in 24 Hours, ADA Bulls React to Market Sentiment Shift - U.Today
Cardano (ADA) has seen significant trading activity recently, with a drop in price from $0.2682 to $0.2590 amid rising selling pressure and global tensions. Increased selling and market sentiment could challenge ADA's stability, but recent adoption efforts may support recovery if trading volumes rise.
UToday1h ago
Geopolitical Turmoil! Dalio Declares "Gold is the Only True God," but Its Safe-Haven Performance Trails Bitcoin
As geopolitical tensions in the Middle East escalate, Bridgewater founder Ray Dalio questions Bitcoin and reaffirms gold as the preferred safe haven. Nevertheless, gold prices fell accordingly, while Bitcoin only experienced a slight correction, indicating that the correlation between the two is weakening. Dalio doubts Bitcoin's transparency and future risks, but he still maintains a small allocation of Bitcoin for diversification.
区块客2h ago
Interest in altcoins cools down: Can Ethereum trigger a new altcoin season?
The market is forcing investors to bring risk management back to the center.
From a technical perspective, the inflow of funds over the past week has driven
TapChiBitcoin2h ago
Aster Price Nears $0.79 Breakout as Reversal Pattern Strengthens
Key Insights
Aster price structure shows an inverse head and shoulders pattern forming beneath $0.79 resistance, signaling growing buying pressure and possible trend reversal ahead.
Repeated tests of the $0.79 neckline suggest weakening selling pressure as buyers steadily absorb supply
CryptoFrontNews5h ago
The HYPE price could surge despite the upcoming $2.8 million short squeeze.
The recent price movements of Hyperliquid (HYPE) are characterized by stagnation around 30 USD. A symmetrical triangle pattern indicates potential for a breakout in either direction, but market sentiment is cautious. Short squeeze risks may boost prices, while weak market flow and deteriorating demand pose challenges. The token could face significant support levels if it dips below 30 USD. An improved market sentiment could lead to a breakout above 33 USD, sparking recovery momentum.
TapChiBitcoin5h ago