Trump Threatens Tariffs on 8 Countries Opposing Greenland Purchase, Bitcoin Crashes Nearly $92,000 on Monday, Nasdaq Futures Drop 1.2%. Daily chart shows rising wedge pattern indicating bearishness, RSI fails to break above mid-zone, potential drop below wedge lower boundary targets $84,000-$80,000. Glassnode data shows large holders (>100,000 BTC) reducing holdings, mid-sized holders buying the dip.
Trump’s Tariff Threat Sparks Risk-Off Sentiment, Bitcoin Follows Lower
On Monday, after US President Trump threatened to impose tariffs on eight countries opposing his Greenland purchase plan, Bitcoin (BTC) and US stock index futures declined together. The top cryptocurrency fell over 1.80%, breaking below $91,920, invalidating last week’s bullish ascending triangle pattern that projected prices above $100,000.
Meanwhile, Nasdaq 100 futures dropped 1.2%, while gold and silver prices rose, indicating increasing risk-off sentiment among investors. Analyst Nick noted: “The US markets are closed today, so investors are expressing their macroeconomic stance through Bitcoin.” He added: “If prices fall below $90,000 before tomorrow’s open, ETF holders may start selling.”
This market reaction highlights Bitcoin’s awkward positioning amid geopolitical risks. While some supporters see Bitcoin as “digital gold” and a safe haven, actual market behavior shows that when genuine risk aversion arises, investors still prefer traditional gold and silver, viewing Bitcoin as a risk asset to be sold. This cognitive gap repeats with every geopolitical crisis.
Trump’s tariff threats not only impact Bitcoin but also trigger a chain reaction in global markets. The decline in US stock futures reflects Wall Street’s concerns over escalating trade tensions, which naturally spill over into crypto markets. In environments of tightening liquidity and declining risk appetite, Bitcoin, as a high-beta asset, often bears the brunt.
Triple Market Impact of Greenland Tariff Crisis
Rising geopolitical risk: Tensions between US and Europe may escalate into a full-scale trade war
Tighter liquidity expectations: Trade war will suppress economic growth and delay rate cut expectations
Risk-off dominance: Funds flow from risk assets into gold and other traditional safe havens
This macro shift makes it difficult for Bitcoin to shake off short-term downside pressure. Unless tariff threats ease or markets adapt to this new normal, Bitcoin may continue to face downward pressure.
Rising Wedge Pattern Indicates Further Pullback Risk
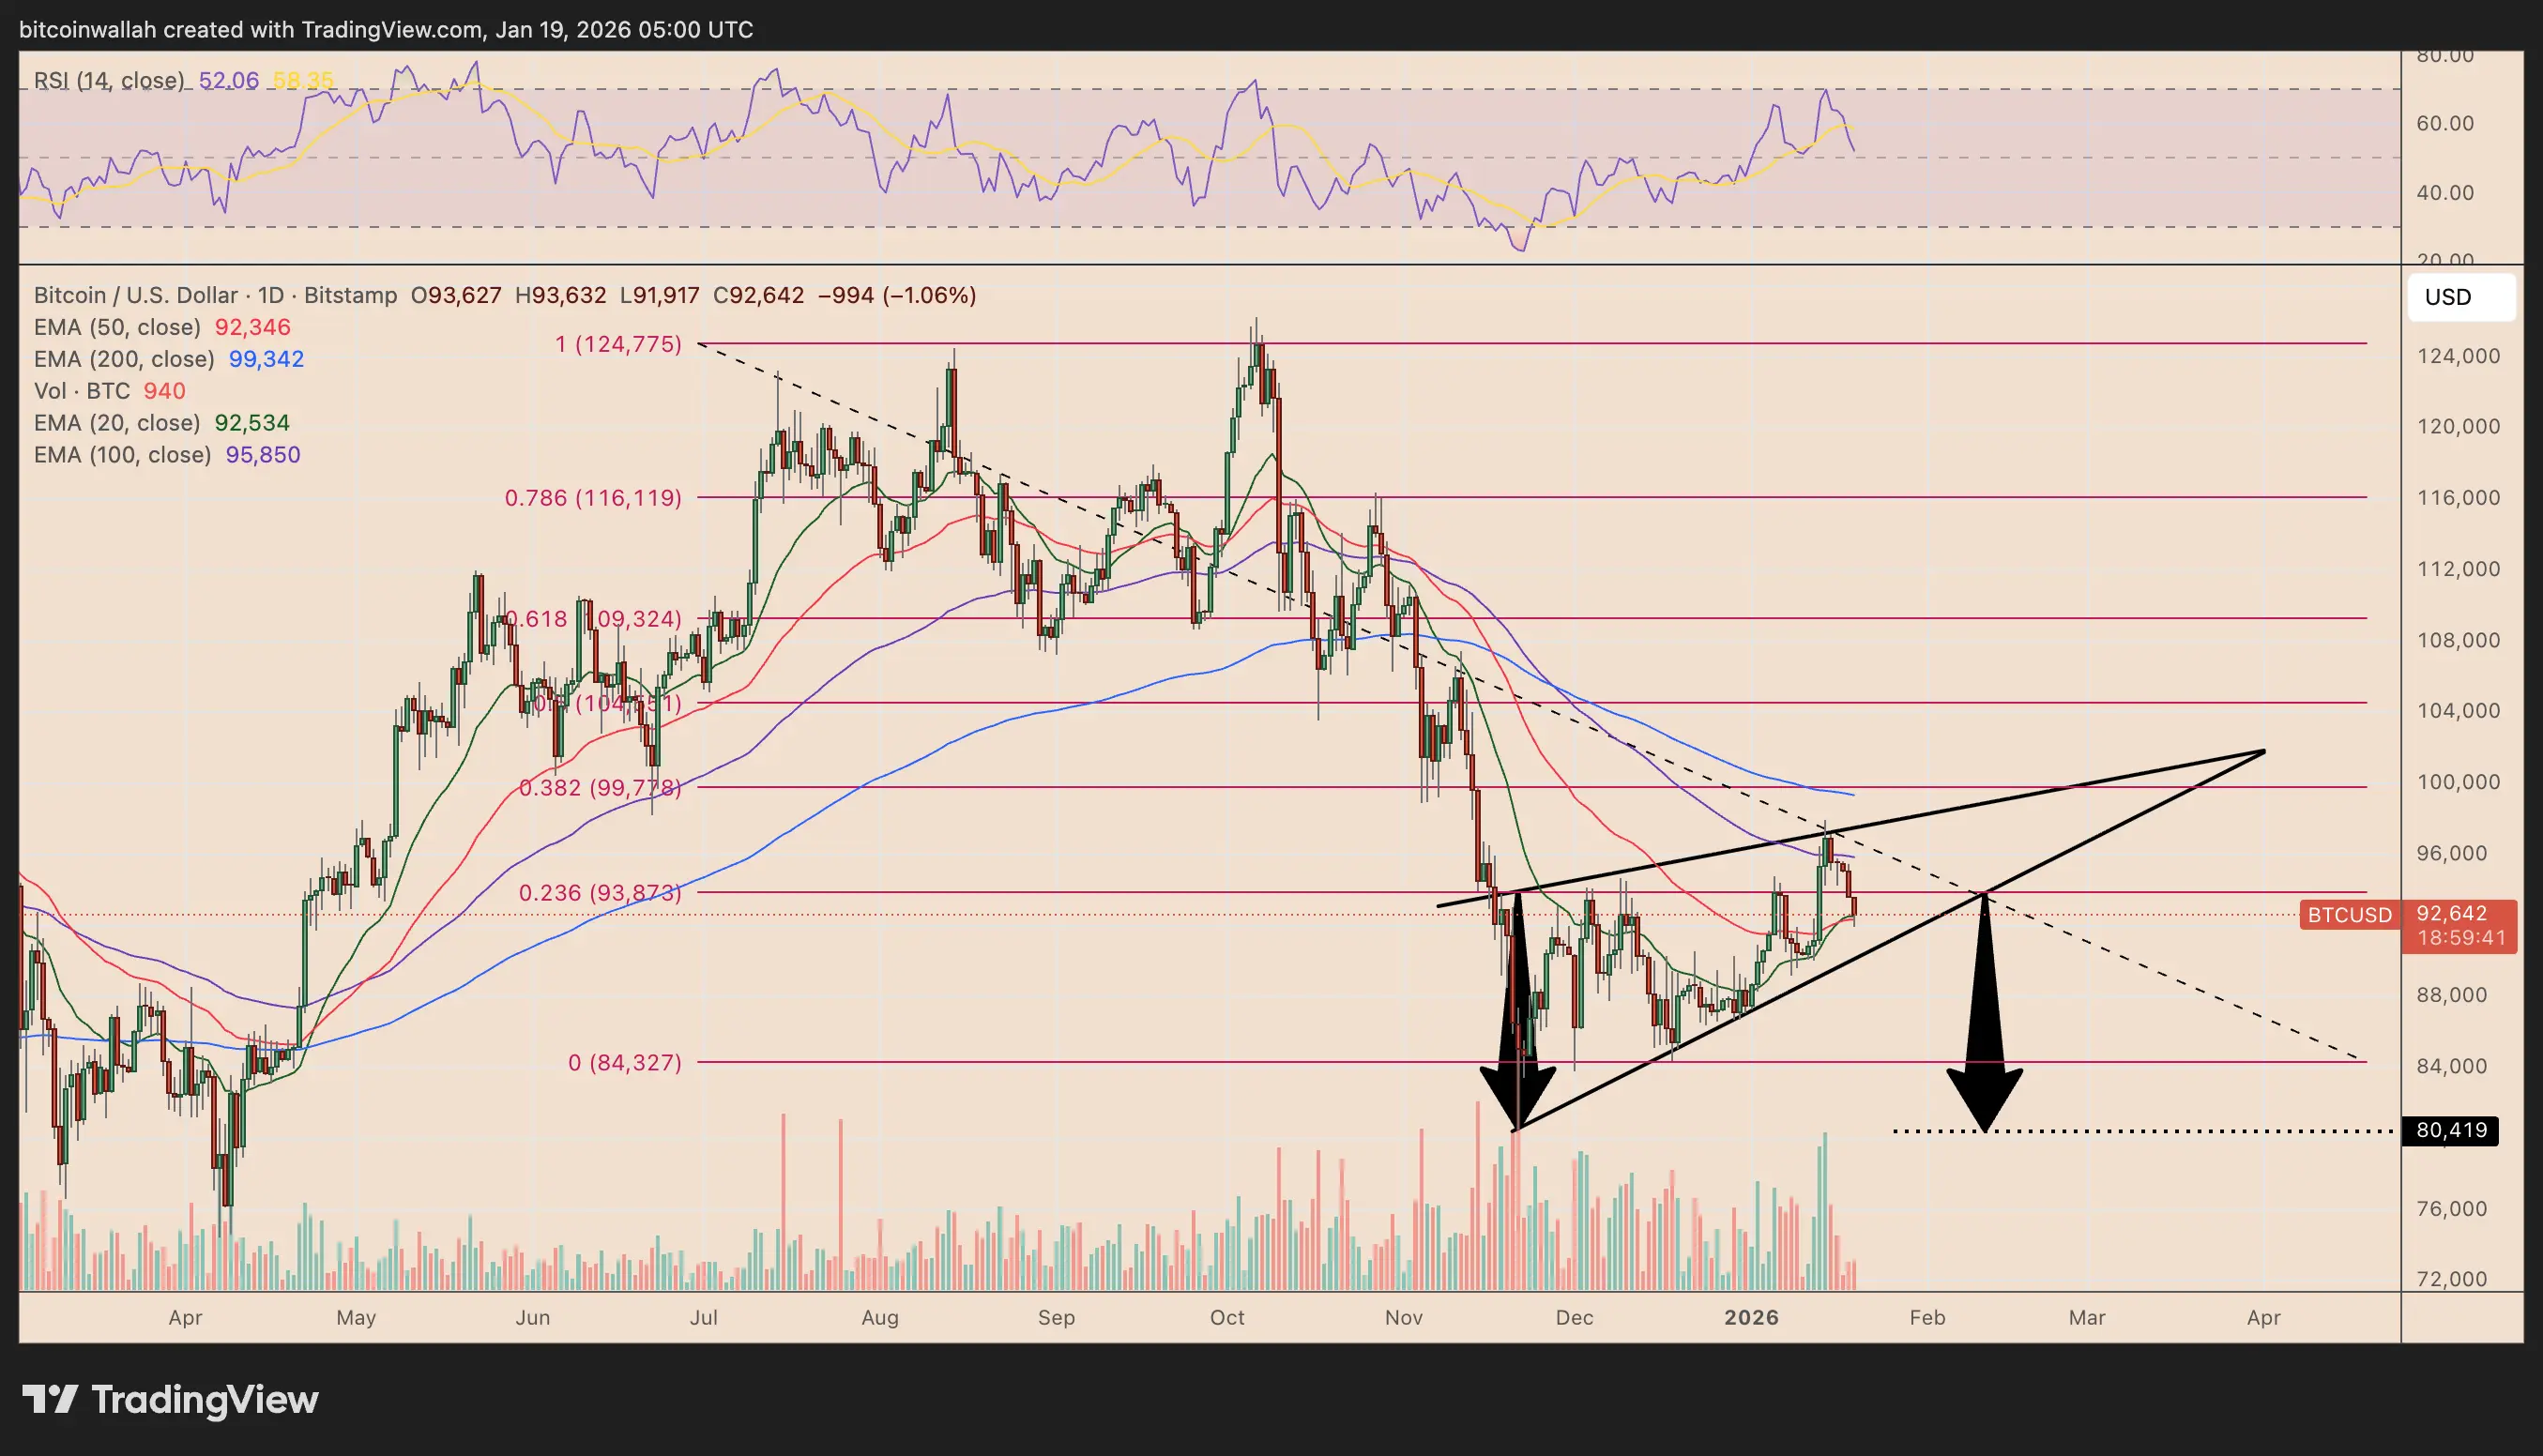
(Source: Trading View)
The Bitcoin daily chart appears to be forming an ascending wedge, a structure often signaling weakening upward momentum during a correction rebound. Prices keep making new lows but with slow upward movement, making it hard for Bitcoin to regain key moving averages clustered around $95,000 to $100,000.
Additionally, the wedge forms below the descending trendline just beneath the November highs, reinforcing supply pressure overhead. Momentum indicators show waning strength; despite multiple attempts, RSI has not effectively broken above the mid-zone. This technical weakness warns of further downside.
An ascending wedge is a classic bearish pattern in technical analysis. Characterized by oscillation between two upward-sloping but converging trendlines, with diminishing gains, it indicates exhaustion of buying power. A break below the wedge’s lower support line often triggers accelerated declines, as stop-losses are hit and traders interpret the breakdown as a shorting signal, adding to selling pressure.
If the price confirms a break below the wedge’s lower trendline, Bitcoin could see a larger correction toward $84,000-$80,000. This zone previously acted as a demand bottom during December’s sell-off. Volume distribution shows heavy historical trading in this range, and the Trump-Greenland tariff push-down represents a significant capitulation zone, often providing support during declines.
Conversely, if the price bounces from the wedge’s lower trendline, a short-term rebound toward the upper trendline is possible, overlapping with the $99,780-$100,000 zone. Traders should reassess this structure; a breakout above the upper boundary would invalidate the bearish wedge, reactivating an ascending triangle pattern with a target of $107,000. This dual scenario offers a clear trading framework: break down to $84,000, break up to $107,000.
On-Chain Data Shows Large Holders Reducing, Mid-Size Accumulates
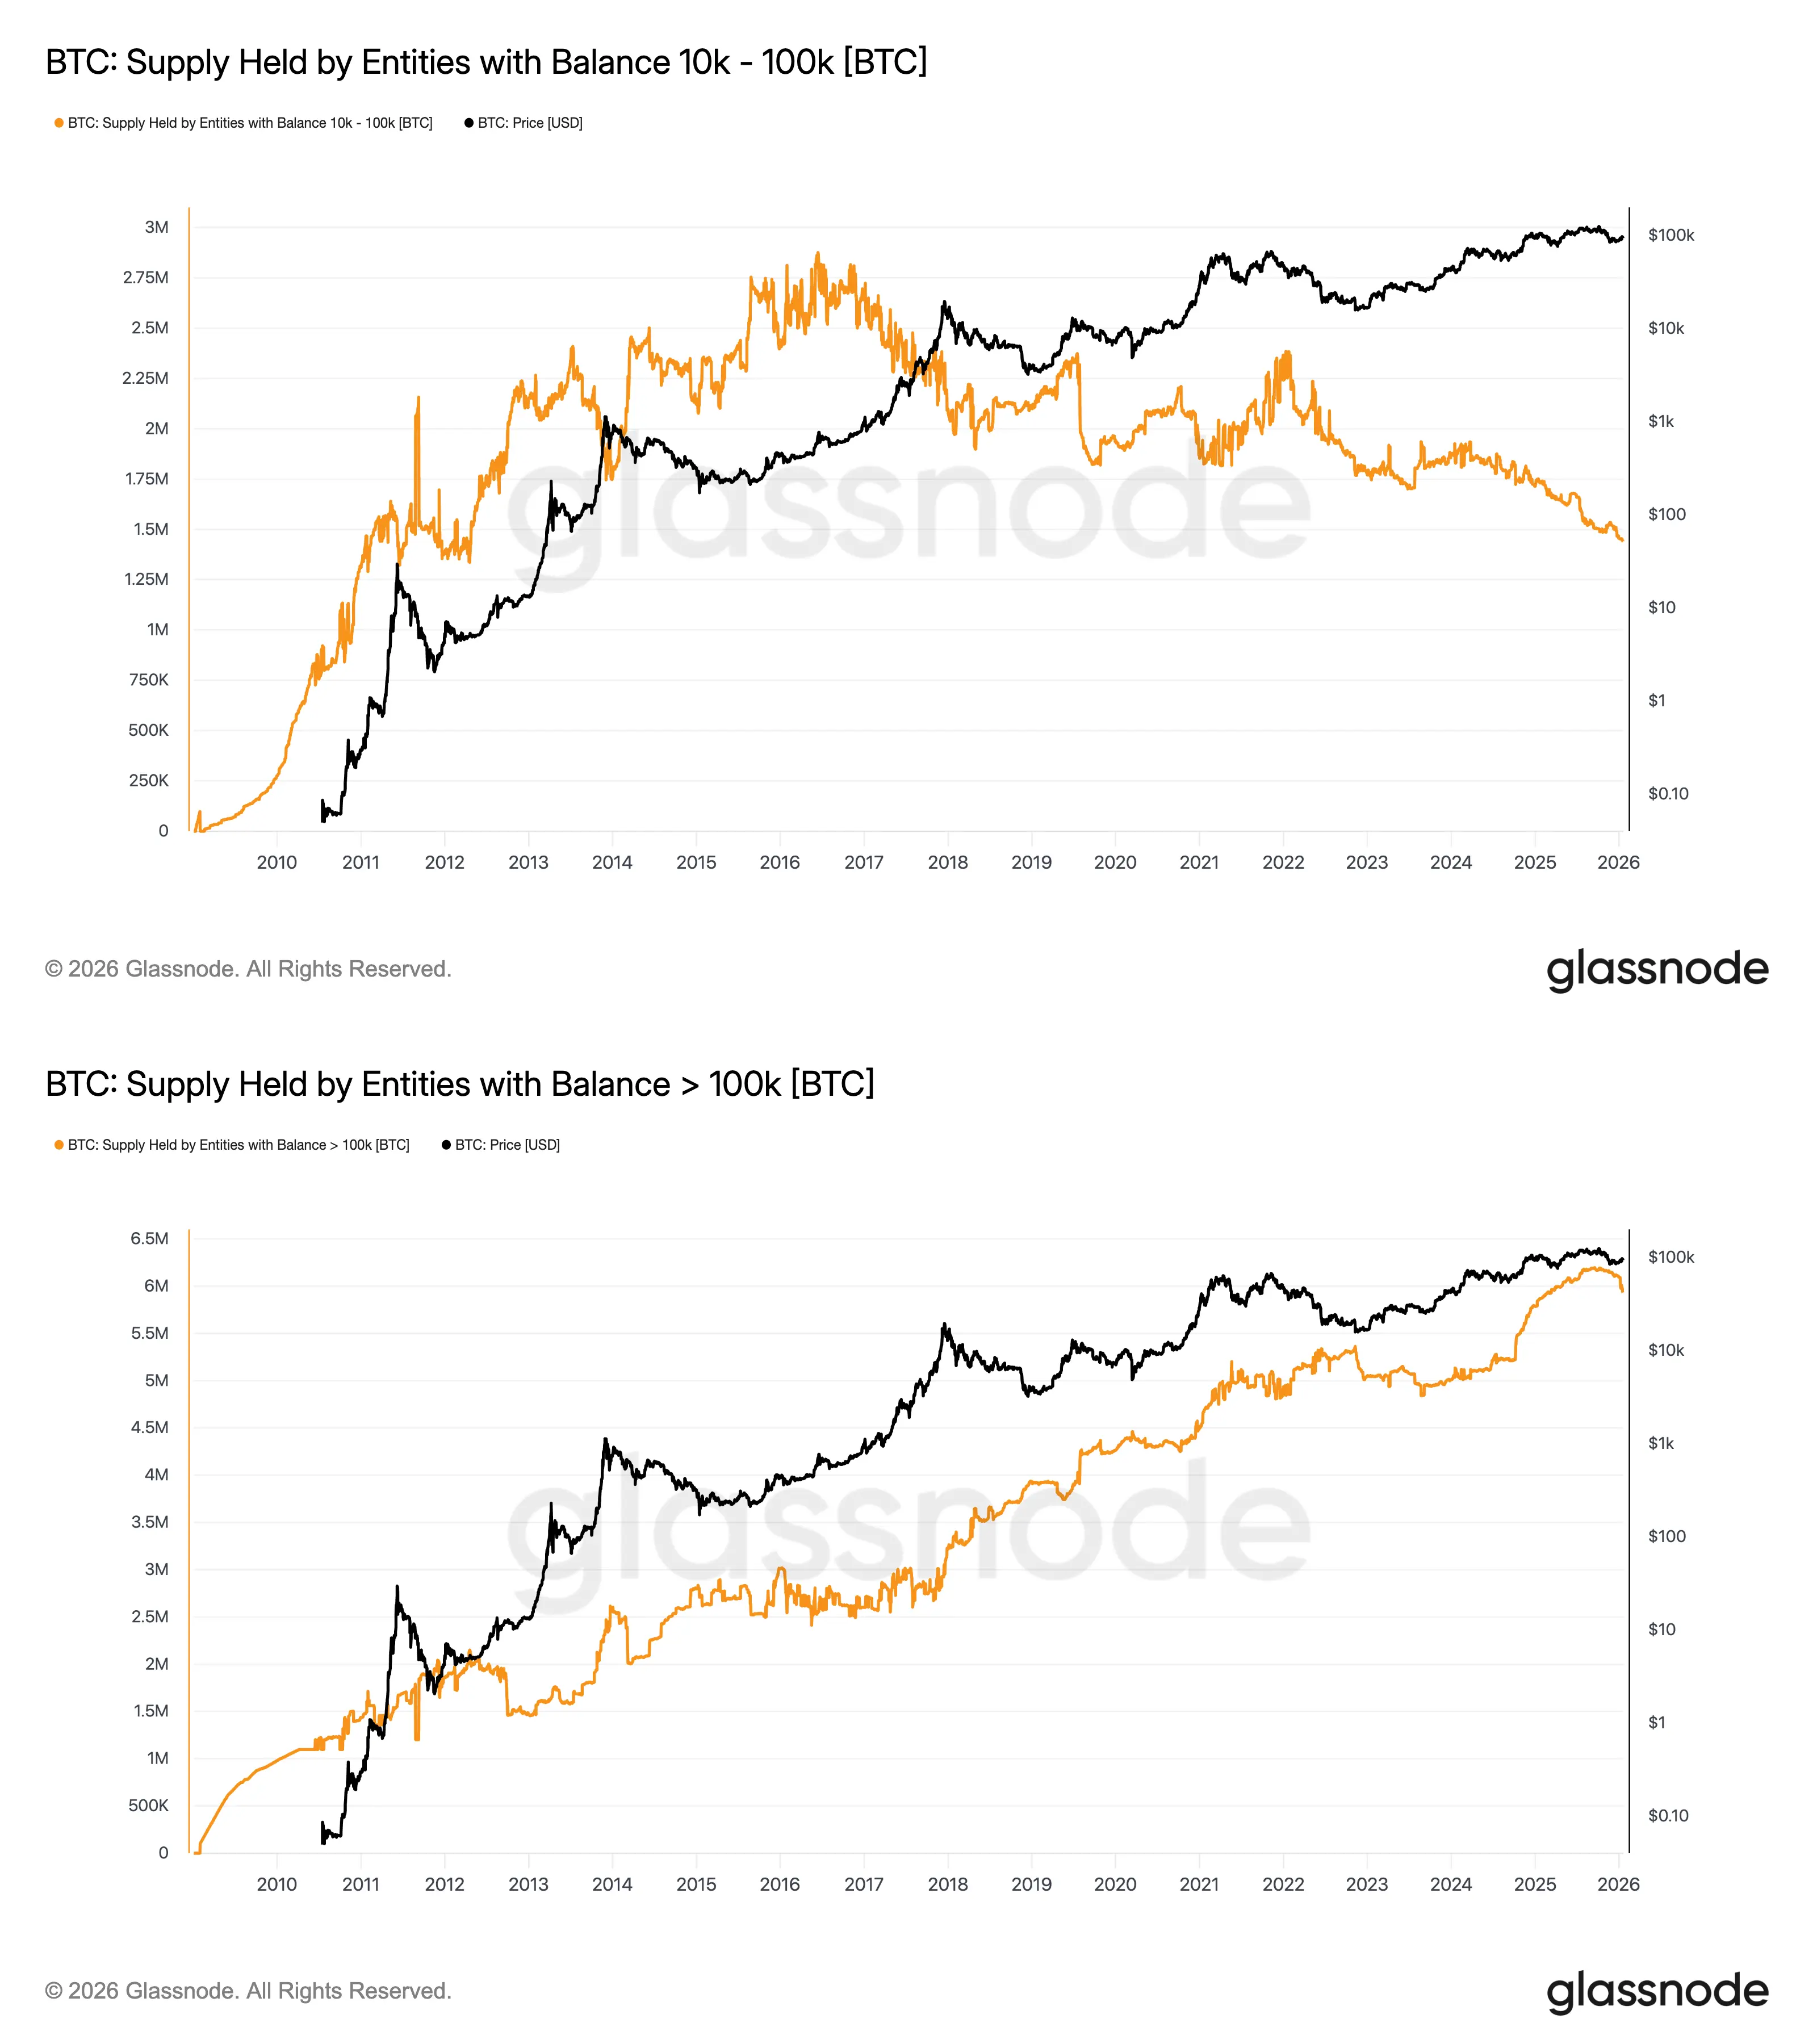
(Source: Glassnode)
Entities holding over 100,000 BTC, as well as those holding 10,000 to 100,000 BTC, are gradually decreasing their supply, indicating a move toward a more distributed market rather than re-accumulation. According to Glassnode data, these top-tier Bitcoin investors are reducing their holdings, a typically bearish signal, as large holders tend to have better information and analysis.
In contrast, wallets holding between 1,000 and 10,000 BTC continue to increase, suggesting mid-sized holders are buying the dip rather than losing confidence. This divergence reflects different investor strategies: large whales lock in profits by reducing positions at high levels, while mid-sized holders see current prices as attractive and add to positions.
This imbalance impacts technical outlooks. The wedge pattern forms under resistance, with large holders reducing their positions, weakening upward momentum. When the biggest buyers exit, relying solely on mid-sized accumulation often cannot sustain a rally. This shift in supply-demand structure is on-chain evidence of Bitcoin’s current weakness.
Historically, large holder reductions often occur near cycle tops or before major corrections. They may base their decisions on macroeconomic views, technical signals, or insider info, preemptively reducing exposure. While mid-sized holders’ buying reflects confidence in long-term value, it often cannot reverse short-term trends. Only when large holders cease reducing or start accumulating again can the market truly bottom and reverse upward.