
Key Takeaways:
-
Privacy Sector Boom: The privacy token market cap has surged by 11.85% in the last 24 hours, now exceeding $24 billion as demand for on-chain anonymity hits a 2026 high.
-
Dash’s Dominant Breakout: Dash (DASH) has emerged as the clear leader, rallying 45% after breaking out of a 4-hour ascending broadening wedge and flipping the 200 MA into support.
-
COTI’s “Lagging” Opportunity: COTI is currently mirroring DASH’s pre-breakout structure. It is testing a critical pivot point at $0.21 and must reclaim the $0.0219 (200 MA) level to trigger a similar relief rally.
Privacy tokens are continues to stay in global spotlight today as the sector’s total market capitalization soared by 11.85% in the last 24 hours. This resurgence comes as investors increasingly seek financial confidentiality amidst tightening global regulatory frameworks and the rise of blockchain surveillance. Leading this charge is Dash (DASH), which has dominated market headlines with a massive 45% bullish surge.
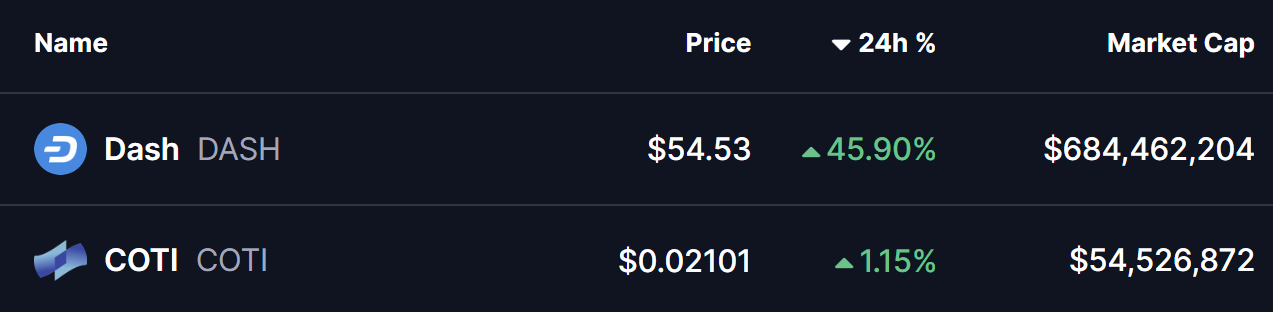
Source: Coinmarketcap
As the market rotates capital into privacy-focused assets, COTI (COTI)—the programmable privacy layer—appears positioned to follow a similar trajectory.
Dash Leads the Privacy Rally
On the 4-hour (4H) chart, DASH has demonstrated a classic technical recovery. The token made a strong bounce from its ascending broadening wedge pattern support, a bullish reversal formation often seen during trend shifts.
After successfully reclaiming its 200-period Moving Average (MA)—a key level that previously acted as heavy resistance—DASH accelerated its momentum. This move culminated in a decisive breakout above the upper boundary of the wedge, resulting in a solid 47% gain from its local lows.
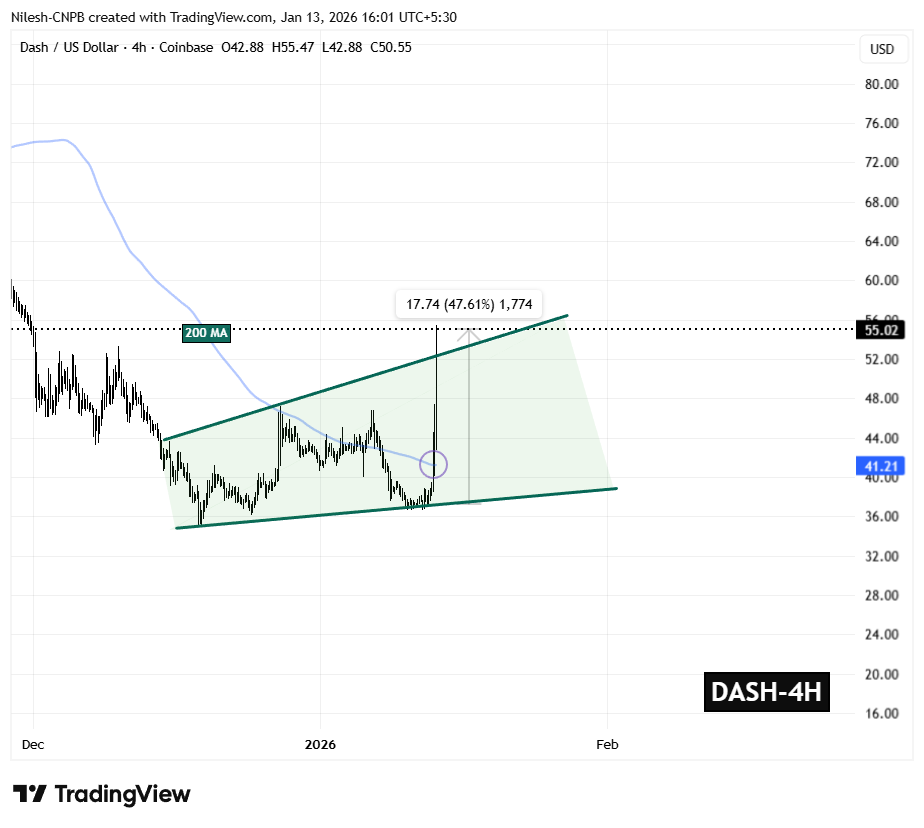
DASH 4H Chart/Coinsprobe (Source: Tradingview)
The Road to $67
As DASH completes its initial breakout, technical analysts anticipate a potential retest of the broken resistance level to confirm it as new support. If the breakout holds, the projected target based on the wedge’s height sits near $67, representing a major milestone for the asset in early 2026.
Is COTI Next?
As the “privacy narrative” expands, COTI is showing a chart structure strikingly similar to DASH’s pre-rally phase.
-
Wedge Support: On the 4H chart, COTI is trading near its own wedge support at $0.21.
-
200 MA Resistance: The token is currently battling the 200 MA resistance at $0.0219.
-
The “Lagging” Effect: Historically, when major privacy assets like DASH or Zcash rally, mid-cap utility tokens in the same sector often experience a delayed “catch-up” move as traders look for undervalued opportunities.
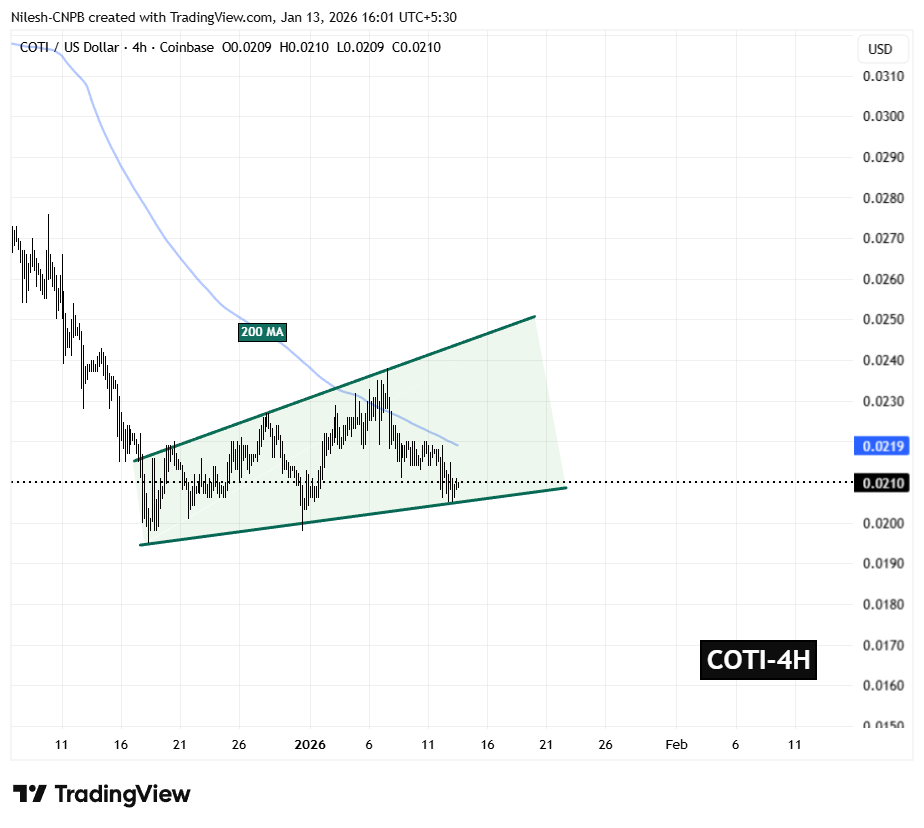
COTI 4H Chart/Coinsprobe (Source: Tradingview)
Fundamental Catalysts for COTI
Beyond the technicals, COTI is fueled by significant 2026 milestones. The network recently underwent its Helium Mainnet Upgrade on January 11, 2026, which enhanced its private computation speed for DeFi and Real-World Assets (RWAs). Furthermore, the upcoming Treasury V3 upgrade is expected to increase token utility and staker participation, providing the fundamental “gas” for a potential breakout.
What’s Next for DASH and COTI?
The privacy sector’s performance in 2026 marks a shift from “niche feature” to “essential utility”.
-
DASH: Must hold its current breakout levels. A successful retest could open the doors for a sustained run toward the $70 range.
-
COTI: For an upside confirmation, COTI must decisively reclaim the 200 MA at $0.0219. A breakout above this level could lead to a test of the upper boundary near $0.025, potentially triggering a rally similar to the one seen in DASH.
As the market enters “Privacy Season,” these two assets remain the primary ones to watch for traders seeking high-volatility opportunities in a changing regulatory landscape.
Disclaimer: The views and analysis presented in this article are for informational purposes only and reflect the author’s perspective, not financial advice. Technical patterns and indicators discussed are subject to market volatility and may or may not yield the anticipated results. Investors are advised to exercise caution, conduct independent research, and make decisions aligned with their individual risk tolerance.
About Author: Nilesh Hembade is the Founder and Lead Author of Coinsprobe, with over 5 years of experience in the cryptocurrency and blockchain industry. Since launching Coinsprobe in 2023, he has been providing daily, research-driven insights through in-depth market analysis, on-chain data, and technical research.
Disclaimer: The information on this page may come from third parties and does not represent the views or opinions of Gate. The content displayed on this page is for reference only and does not constitute any financial, investment, or legal advice. Gate does not guarantee the accuracy or completeness of the information and shall not be liable for any losses arising from the use of this information. Virtual asset investments carry high risks and are subject to significant price volatility. You may lose all of your invested principal. Please fully understand the relevant risks and make prudent decisions based on your own financial situation and risk tolerance. For details, please refer to
Disclaimer.
Related Articles
Aster Price Nears $0.79 Breakout as Reversal Pattern Strengthens
Key Insights
Aster price structure shows an inverse head and shoulders pattern forming beneath $0.79 resistance, signaling growing buying pressure and possible trend reversal ahead.
Repeated tests of the $0.79 neckline suggest weakening selling pressure as buyers steadily absorb supply
CryptoFrontNews2h ago
The HYPE price could surge despite the upcoming $2.8 million short squeeze.
The recent price movements of Hyperliquid (HYPE) are characterized by stagnation around 30 USD. A symmetrical triangle pattern indicates potential for a breakout in either direction, but market sentiment is cautious. Short squeeze risks may boost prices, while weak market flow and deteriorating demand pose challenges. The token could face significant support levels if it dips below 30 USD. An improved market sentiment could lead to a breakout above 33 USD, sparking recovery momentum.
TapChiBitcoin2h ago
Ethereum Price Holds Key Support: Is $2,200 the Next Test for ETH?
March 6, 2026 7:15 pm EST
TheCoinRepublic4h ago
Cardano Price Trends: Bulls Eye Opportunity as Indicator Flashes Green
ADA: Trading near $0.27, facing resistance at $0.28 and support at $0.26.
Technical Indicators: RSI and MACD show weak momentum, signaling short-term consolidation and cautious trading.
Macro Outlook: Rising PMI and historical patterns suggest potential bullish rebound if resistance
CryptoNewsLand4h ago
CryptoQuant: Bitcoin NUPL--MVRV indicator reaches 0.33, or has entered the mid-stage of a bear market
Gate News Announcement, March 7th, CryptoQuant analyst Axel pointed out on the X platform that the Bitcoin NUPL--MVRV harmonic composite indicator has reached 0.33, while historical cycle bottoms typically occur around the 0.5 range. The chart shows that the bear market cycle is beginning to shift upward, indicating that Bitcoin may have entered the mid-stage of this bear market cycle, suggesting that extreme selling conditions are easing. However, this indicator is still well above historical bottom levels, implying that a market-wide bottom has not yet been confirmed.
GateNews5h ago
ZEC Price Analysis: Upcoming Trends and Targets for the Next Few Weeks
ZEC: Stabilized near $200 support, rebounding toward $250 resistance after prolonged bearish pressure.
Technical Indicators: RSI and MACD show gradual improvement, signaling moderate bullish momentum returning.
Market Outlook: Sustained above $240 could push ZEC toward $268, while
CryptoNewsLand5h ago