![]() Trusted Editorial content, reviewed by leading industry experts and seasoned editors. Ad Disclosure
XRP has once again traded directly into a price zone that a few traders have come to recognize as a liquidity pocket. This area has acted as a magnet for price since December 2024, causing repeated tests and reactions that stand out clearly on the price chart In a recent technical breakdown shared on X, crypto analyst ChartNerd highlighted how XRP has repeatedly made contact with this liquidity pocket over the past year and the cryptocurrency might be approaching a relief bounce.
Trusted Editorial content, reviewed by leading industry experts and seasoned editors. Ad Disclosure
XRP has once again traded directly into a price zone that a few traders have come to recognize as a liquidity pocket. This area has acted as a magnet for price since December 2024, causing repeated tests and reactions that stand out clearly on the price chart In a recent technical breakdown shared on X, crypto analyst ChartNerd highlighted how XRP has repeatedly made contact with this liquidity pocket over the past year and the cryptocurrency might be approaching a relief bounce.
Liquidity Pocket: Support Or Springboard?
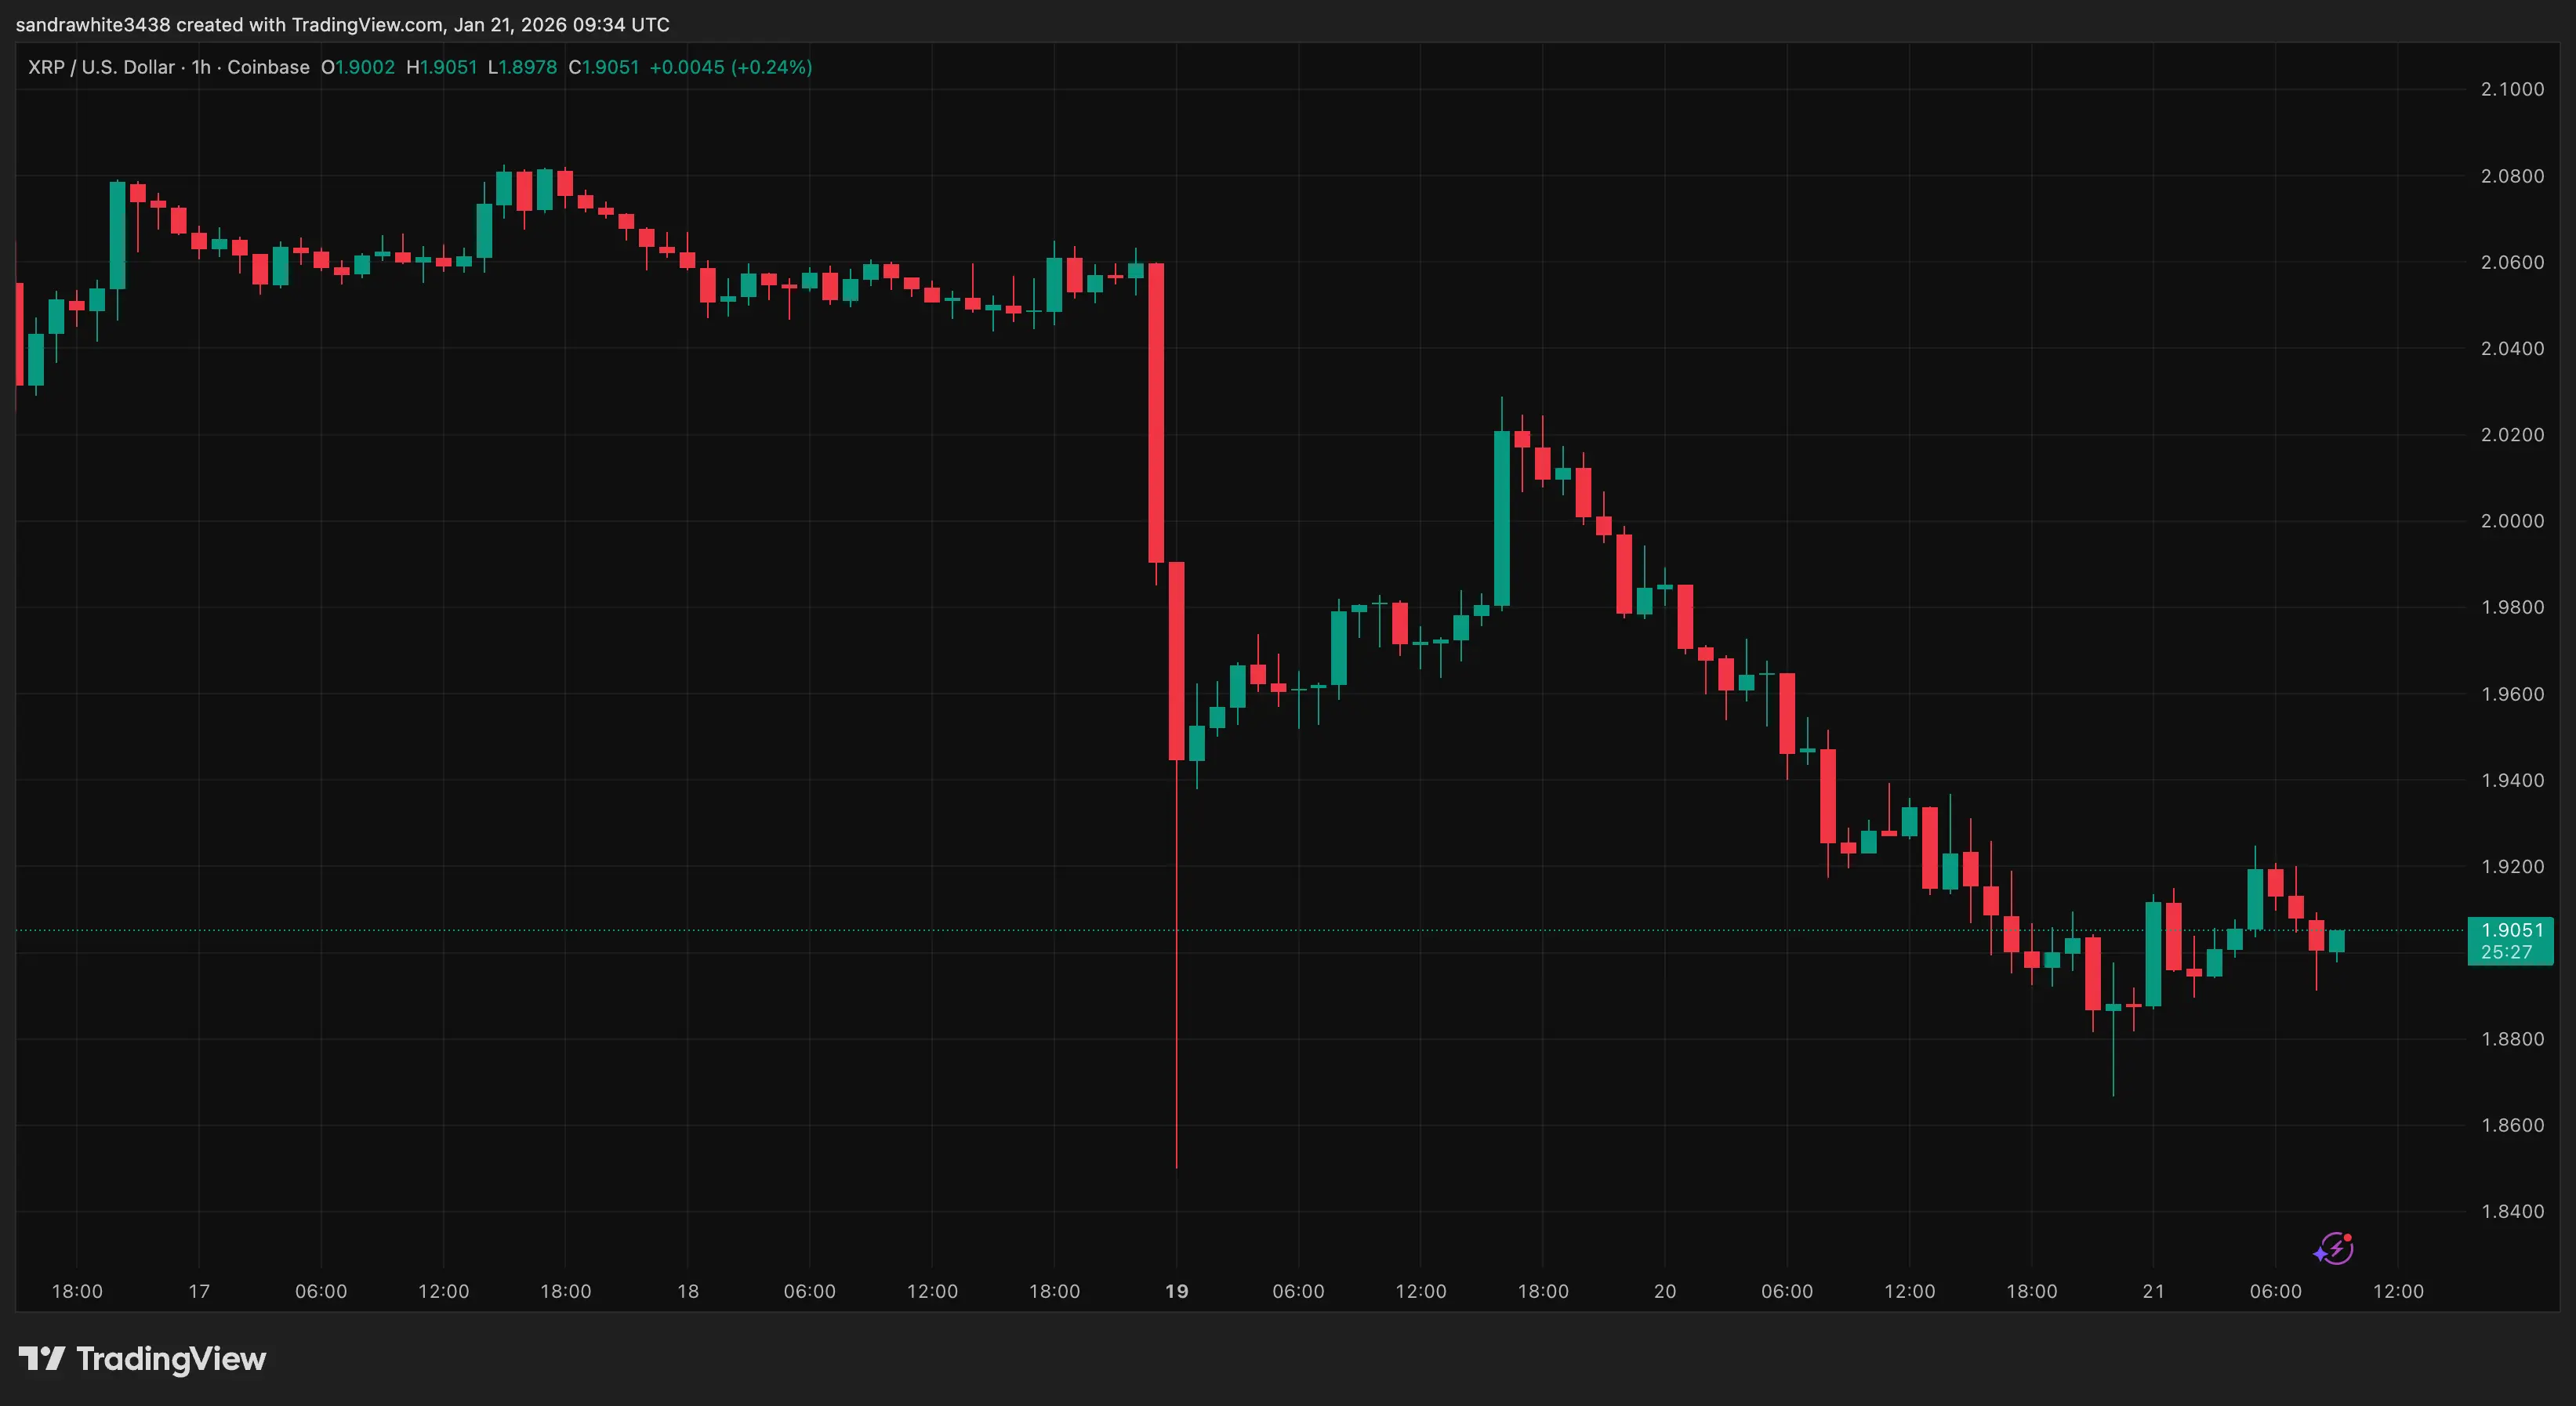
Technical analysis of XRP’s price action shows that the cryptocurrency is now trading within a liquidity zone that has acted as a support range since December 2024. This liquidity zone, which spans the range from $1.90 to $1.75, has acted as a price magnet for many months. Even after reaching its all-time high of $3.65 in July 2025, XRP entered into a multi-month correction that eventually found support at this liquidity zone.
Related Reading: XRP’s Blessing In Disguise: How Investors Could Benefit SoonAccording to the analysis, nearly every prior visit to this zone was followed by some form of relief, especially when momentum indicators aligned. The last time XRP returned to this level, it slowed down its decline and eventually bounced back above $2.4 in early January.
However, the most recent push downwards played out as a 20% decline after a rejection at the $2.40 zone in early January, which has essentially pushed the XRP price action back to trading within this liquidity range and has started to show tentative stabilization
To bring further confirmation to the setup, the analyst included the daily Stochastic RSI below the price chart. This momentum indicator, which measures relative strength and conditions of overbought or oversold pressure, is currently sitting in deeply oversold territory according to the chart. These oversold conditions in the Stoch RSI aligned with rebounds off this same liquidity pocket.
![XRP Liquidity pocket]()
XRP Price Chart. Source: @ChartNerdTA On X
What Happens Next?
If history repeats itself, the repeated tests of this liquidity pocket and accompanying oversold signals might be clearing the road for a bounce. If XRP was underneath this pocket and rejecting at this level, that would be bearish. Holding it as support for a long duration points to a strong support strength in this area.
Related Reading: What To Expect For The Bitcoin Price This Week After Psychological BreakdownThat said, there is another possibility that the reverse could happen. Should XRP break decisively below this zone with strong selling pressure, the technical setup would shift from supportive to bearish and leave the price action trending downwards.
Trading activity hints that recent buyers may be in a tough spot, because the mix of holders now resembles the early 2022 structure when price pressure was high. That means many participants may be below their breakeven cost basis, and this can build selling pressure over time if prices fail to move higher.
 Price fails to recover | Source: XRPUSDT on Tradingview.comFeatured image created with Dall.E, chart from Tradingview.com
![]() Editorial Process for bitcoinist is centered on delivering thoroughly researched, accurate, and unbiased content. We uphold strict sourcing standards, and each page undergoes diligent review by our team of top technology experts and seasoned editors. This process ensures the integrity, relevance, and value of our content for our readers.
Editorial Process for bitcoinist is centered on delivering thoroughly researched, accurate, and unbiased content. We uphold strict sourcing standards, and each page undergoes diligent review by our team of top technology experts and seasoned editors. This process ensures the integrity, relevance, and value of our content for our readers.
Disclaimer: The information on this page may come from third parties and does not represent the views or opinions of Gate. The content displayed on this page is for reference only and does not constitute any financial, investment, or legal advice. Gate does not guarantee the accuracy or completeness of the information and shall not be liable for any losses arising from the use of this information. Virtual asset investments carry high risks and are subject to significant price volatility. You may lose all of your invested principal. Please fully understand the relevant risks and make prudent decisions based on your own financial situation and risk tolerance. For details, please refer to
Disclaimer.
Related Articles
Will Ripple’s XRP Operate As SWIFT Substitute Or Partner?
Since 1973, The Society for Worldwide Interbank Financial Telecommunication (SWIFT) has been working to connect the banks of the globe into a one, trustworthy network.
With most merchants now expecting payments to settle in under an hour, SWIFT’s XRP & HBAR testing on their rails last year
DailyCoin3m ago
3 Promising Altcoins to Accumulate for 2026 — SOL, XRP, and AVAX
Solana offers high speed performance and growing institutional support.
XRP gains strength from regulatory clarity and global payment adoption.
Avalanche attracts enterprises with modular blockchain infrastructure.
Investors who think ahead often gain the greatest rewards. As 2026 gains
CryptoNewsLand13m ago
XRP Could Face Securities Classification Under New U.S. Crypto Framework, Says Cardano’s Hoskinson
Charles Hoskinson argues that under the revised CLARITY Act, tokens like XRP would qualify as securities, igniting his feud with the XRP community.
He called Ripple CEO Brad Garlinghouse out again, cautioning that having no laws is better than having a bad law.
Cardano founder Charles Hoskin
CryptoNewsFlash29m ago
Grok AI Predicts The Price Of XRP And Solana If The U.S. And Iran Sign A Peace Deal
Tensions between the United States, Israel, and Iran have escalated into a full military campaign as of March 6, 2026. Operation Epic Fury has now entered its seventh day. Heavy airstrikes have hit Tehran and several strategic locations across Iran.
Forces from the United States and Israel hav
CaptainAltcoin49m ago
XRP Has Chance to Break $1.45 Resistance, Peter Brandt Predicts Bitcoin May Not Rally Until After September, +844 Billion SHIB: Shiba Inu Hits 2026 High in Exchange Inflow: Morning Crypto Report - U.Today
XRP may be 1% short of weekend breakout: Bollinger Bands
Peter Brandt updates Bitcoin outlook with September angle
Shiba Inu sees 844 billion SHIB exchange influx, sets 2026 record
Crypto market outlook: All eyes on U.S. jobs print
TL;DR
XRP pivot point: XRP is battling the $1.404
UToday51m ago