The Kaspa (KAS) is trading around the $0.041 area as the new week begins, with price still struggling to regain momentum after a long corrective phase.
On the development side, Kaspa has continued to expand its real-world narrative. A new non-profit industrial initiative was launched last week to push Kaspa into regulated finance and supply chain use cases.
At the same time, analysts have pointed out that the KAS price needs to clear the $0.046 level to confirm a proper recovery.
The recent launch of K-Social has also added a utility layer to the ecosystem, showing Kaspa’s focus on censorship-resistant communication. Even with these developments, the KAS price remains under pressure on the chart.
- What the KAS chart is showing
- What market indicators are saying
- KAS price short-term outlook for this week
What the KAS chart is showing
On the 4H chart, Kaspa is clearly in a broader downtrend that began after the sharp sell-off in mid-October. That drop changed the structure of the market, and price has not managed to reclaim key resistance levels since.
After that major breakdown, the KAS price attempted a recovery toward the $0.060 area but failed to hold it. Since then, price has been moving lower in a controlled and steady manner. Over the past weeks, KAS has been moving sideways between $0.040 and $0.046.
Right now, price is sitting near the lower end of that range. Sellers have not pushed it much lower, but buyers are also not stepping in with strength yet.
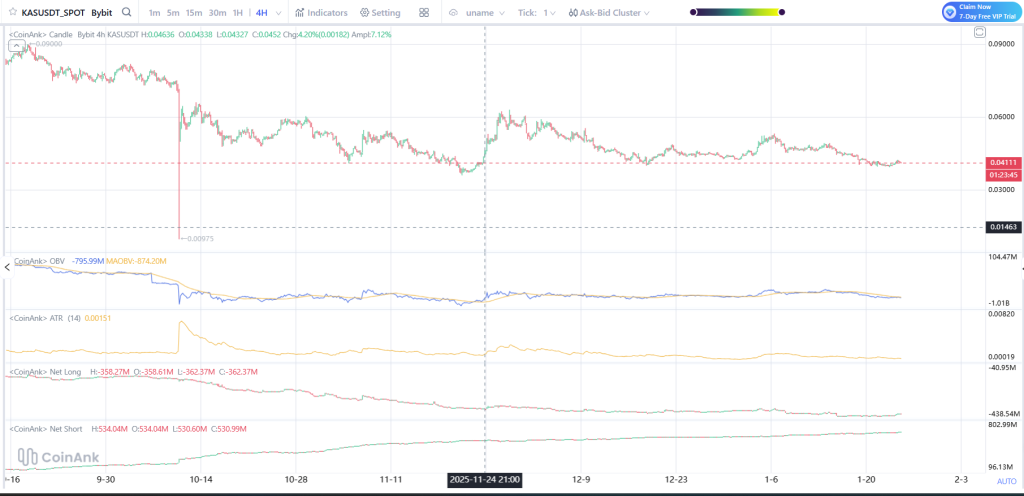
Source: Coinank
What market indicators are saying
OBV is still low, showing that strong buying has not returned yet. It has flattened lately, which means selling is slowing down, but real accumulation is still missing.
ATR has dropped since the big move in October, which tells us volatility is fading. This often happens before price makes its next larger move.
The position data shows that even more traders are taking a short position, and the long position is declining further, which is a confirmation that the overall sentiment of the market is bearish, even though the price is no longer dropping significantly.
Both of these indicate that the market is settling down, but it is not yet giving a clue of reversal.
_****SUI Moves Beyond the “Solana Killer” Label With a Privacy-First Shift**
KAS price short-term outlook for this week
Kaspa is supported in its range of $0.040 to $0.039. So long as it sustains, we consider it stable in terms of price.
If the KAS price rises and sustains its position past $0.046, then the resistance levels are $0.050 and then $0.055. Trespassing $0.055 will be the first clear sign for investors that prices are trying to move higher.
If KAS declines below $0.039, subsequent support levels are at around $0.035 and $0.030.
For the Kaspa price in the upcoming week, it is could range from $0.040 to $0.046. A rise above these values is expected to favor buyers, while a fall below $0.039 is expected to favor sellers.
Disclaimer: The information on this page may come from third parties and does not represent the views or opinions of Gate. The content displayed on this page is for reference only and does not constitute any financial, investment, or legal advice. Gate does not guarantee the accuracy or completeness of the information and shall not be liable for any losses arising from the use of this information. Virtual asset investments carry high risks and are subject to significant price volatility. You may lose all of your invested principal. Please fully understand the relevant risks and make prudent decisions based on your own financial situation and risk tolerance. For details, please refer to
Disclaimer.
Related Articles
CryptoQuant Analyst: Bitcoin NUPL-MVRV indicator reaches 0.33, indicating that extreme selling conditions are moderating
Gate News Announcement, March 8 — CryptoQuant analyst Axel posted on X platform that Bitcoin may have entered the mid-stage of this bear market cycle. Data shows that the NUPL–MVRV harmonic composite indicator has reached 0.33, while historical cycle bottoms typically occur around the -0.5 level. The chart indicates that the start of the bear market cycle is trending upward, suggesting that extreme selling conditions are moderating. However, the indicator remains well above historical bottom levels, indicating that a full-scale market sell-off has not yet been confirmed.
GateNews10m ago
Polkadot to Reset Tokenomics on March 12 With Major DOT Supply and Staking Changes
Polkadot will introduce a new monetary framework on March 12 that sets DOT’s supply cap at 2.1 billion and lowers emissions by 53.6%.
The overhaul will also create a Dynamic Allocation Pool and shorten the DOT unbonding period from 28 days to 24–48 hours.
On March 12, Polkadot will reset
CryptoNewsFlash4h ago
Bitcoin May Be Closer to a Bottom Than Most Think, Chart Signals
The Bitcoin price slipped about 2% today, trading slightly below $68,000 after pushing above $73,000 earlier this week, as already covered on our site. The move added fresh pressure to a market that still feels shaky, especially after several failed attempts to hold higher levels.
Still, not e
CaptainAltcoin4h ago
Dogecoin Monthly Breakdown Pattern Reappears as Price Tests $0.0918
Dogecoin is currently trading at $0.09205 at a gain of 2.3, with support of above $0.08878.
As can be seen in the monthly chart, there are recurring breakdown areas that have been followed by significant expansions in price.
The short-term trading range is narrow and the immediate point o
CryptoNewsLand4h ago
Solana Eyes $90.6 Trigger Point as $83 Support Holds and Liquidation Pressure Builds
A large cluster of short positions faces liquidation if SOL reaches $90.6, potentially increasing volatility.
SOL trades between $83.00 support and $89.58 resistance, keeping price action compressed in the short term.
SOL posts a 0.8% daily gain and rises 0.7% against BTC, holding
CryptoNewsLand4h ago
Crypto Market Plunges As Extreme Fear Controls Investor Sentiment
The global crypto market is notably bearish, with a 2.93% drop in market capitalization to $2.32T. Bitcoin and Ethereum saw decreases of 3.07% and 4.01%, respectively. Meanwhile, notable gainers include $XBTC, $TRUMP, and $PEPE. DeFi TVL and NFT sales also declined significantly, while key investments from YZi Labs and Kazakhstan's central bank emerged.
BlockChainReporter5h ago