
Key Takeaways
-
SAND price is showing early signs of stabilization after recent downside pressure.
-
Buyers appear to be defending a key support zone, hinting at a potential short-term rebound.
-
A breakout above nearby resistance could open the door for a stronger recovery move.
Gaming-focused crypto tokens are back in the spotlight after Axie Infinity (AXS) posted a sharp rally of over 16% in a single day and more than 246% over the past month, reigniting optimism around the gaming narrative. Riding this renewed momentum, Sandbox (SAND) has also stepped into focus, climbing nearly 45% as overall market sentiment turns constructive.
Beyond the recent price bounce, the technical structure on the chart is starting to tell a bigger story, hinting that SAND may be setting up for a bullish continuation move.
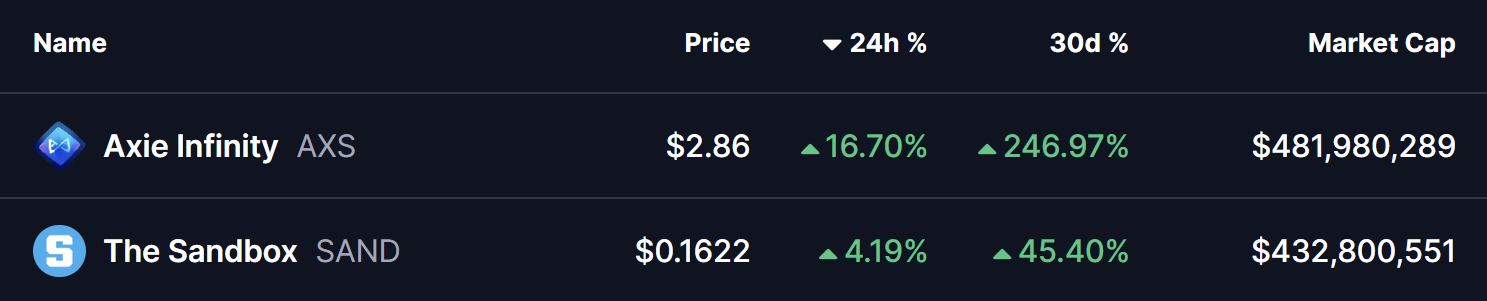
Source: Coinmarketcap
Descending Broadening Wedge Pattern in Play
On the daily timeframe, SAND is trading within a descending broadening wedge — a bullish reversal pattern that often develops during corrective phases before a trend shift. This structure reflects increasing volatility, with price gradually compressing while buyers quietly regain control.
During the latest pullback, SAND successfully retested the lower boundary of the wedge near the $0.11 zone, an area that has repeatedly acted as strong demand. Buyers stepped in aggressively at this level, triggering a rebound that pushed price toward $0.1711, placing SAND right near the wedge’s upper resistance trendline.
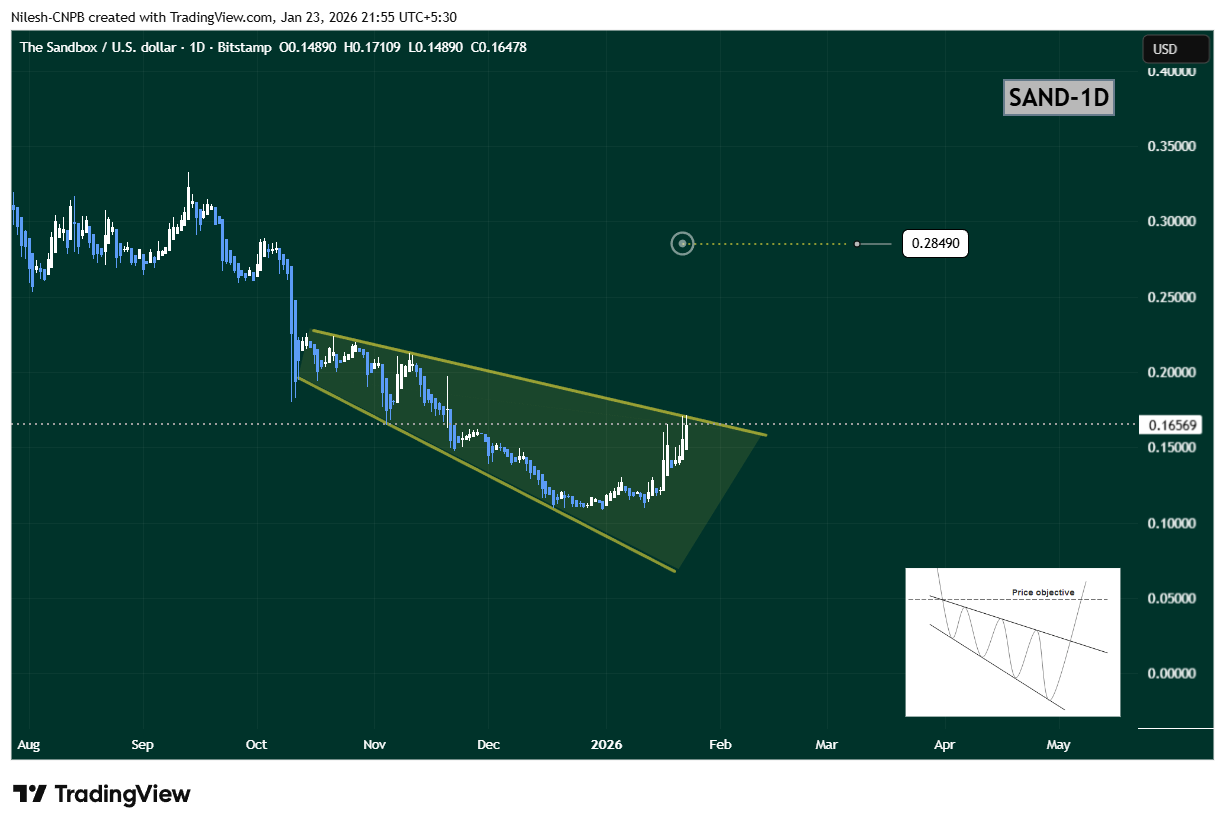
Sandbox (SAND) Daily Chart/Coinsprobe (Source: Tradingview)
The steady rise toward this upper boundary suggests growing bullish momentum and increasing breakout pressure.
What’s Next for SAND?
If buyers manage to push SAND above the upper wedge resistance near $0.1711, it would confirm a bullish breakout from the pattern. In that scenario, the chart opens the door for a move toward the $0.2849 target, which aligns with the measured move of the wedge and represents roughly 73% upside from current levels.
However, if price faces rejection at resistance, SAND could continue consolidating within the wedge structure. In that case, the $0.13–$0.14 region will act as an important short-term support zone to watch.
Bottom Line
SAND’s overall technical structure remains constructive. With a bullish descending broadening wedge in play, buyers defending key support, and gaming tokens gaining renewed attention, Sandbox appears to be positioning for a potential breakout. A confirmed move above resistance could mark the beginning of a stronger upside phase in the sessions ahead.
Disclaimer: The views and analysis presented in this article are for informational purposes only and reflect the author’s perspective, not financial advice. Technical patterns and indicators discussed are subject to market volatility and may or may not yield the anticipated results. Investors are advised to exercise caution, conduct independent research, and make decisions aligned with their individual risk tolerance.
About Author: Nilesh Hembade is the Founder and Lead Author of Coinsprobe, with over 5 years of experience in the cryptocurrency and blockchain industry. Since launching Coinsprobe in 2023, he has been providing daily, research-driven insights through in-depth market analysis, on-chain data, and technical research.
Disclaimer: The information on this page may come from third parties and does not represent the views or opinions of Gate. The content displayed on this page is for reference only and does not constitute any financial, investment, or legal advice. Gate does not guarantee the accuracy or completeness of the information and shall not be liable for any losses arising from the use of this information. Virtual asset investments carry high risks and are subject to significant price volatility. You may lose all of your invested principal. Please fully understand the relevant risks and make prudent decisions based on your own financial situation and risk tolerance. For details, please refer to
Disclaimer.
Related Articles
Bittensor (TAO) Tests Crucial $180 Level Amid Renewed AI + Crypto Interest
Michaël van de Poppe's insights on TAO hint at a key resistance level at $180 that could lead to higher prices if surpassed. The token's tie to Bittensor and the AI-crypto narrative keeps it in focus as traders monitor its performance and volume for potential gains.
BlockChainReporter12m ago
HBAR Faces Renewed Pressure as $0.09 Support Weakens
Key Insights:
HBAR price repeatedly failed to clear value area high resistance, reinforcing overhead supply and weakening bullish momentum within the current range structure.
The $0.09 high timeframe support now defines short term direction as price rotates lower inside a clearly
CryptoFrontNews36m ago
Culper Research shorted Ethereum, citing the upgrade as the trigger for a death spiral
Culper Research report indicates that Ethereum's Fusaka upgrade caused excess block space, leading to a 90% drop in transaction fees, potentially entering a "death spiral" cycle, resulting in decreased staking demand and network security. The report mentions Vitalik Buterin selling large amounts of ETH, questioning Tom Lee's bullish outlook, and points out BitMine's loss risks held in Ethereum.
MarketWhisper48m ago
Pi Network Today's News: $0.20 Becomes the Bull-Bear Threshold, Token Unlock Adds Variables
Pi Network (PI) tokens recently surged in price, breaking through $0.1900, with a total increase of about 15%. Market sentiment has improved, and the fear index has risen back to 29. However, 20.8 million PI tokens will be unlocked on Saturday, which could increase selling pressure and pose a short-term risk to the price. If it can break through $0.1959, the target price is $0.2613; but a drop below the 50-day moving average could turn the trend bearish.
MarketWhisper59m ago
Glassnode: Bitcoin selling pressure has eased, but institutional demand remains in the testing phase
PANews March 6 News, Glassnode posted on X platform analyzing that the outflow trend of Bitcoin spot ETF funds has stabilized. The 14-day net flow trend has turned upward, indicating that as Bitcoin breaks through $70,000, selling pressure is easing. Institutional demand remains in a tentative stage, but early signs of reaccumulation are beginning to appear.
GateNews1h ago
XRP Today's News: Musk X Money Beta Released, Sparks On-Chain Integration Speculation
Elon Musk's X company has launched a beta version of the X Money payment system, allowing users to transfer and manage funds, sparking widespread discussion about XRP integration. Although there are no official plans for cryptocurrency integration at the moment, the market is generally optimistic. Analysts believe that XRP has design advantages for payments, especially with improved regulatory environments, making it more promising. However, the practicality of stablecoins is also under scrutiny. XRP is currently testing the $1.50 technical resistance level. If successfully broken through, it could trigger further gains.
MarketWhisper1h ago

